解説
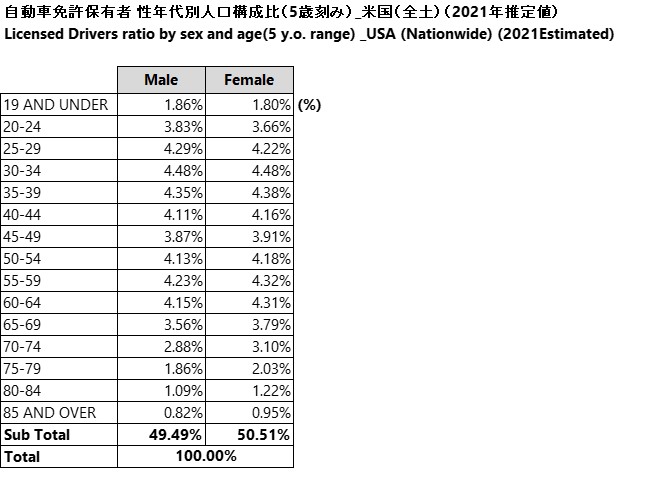
※四捨五入の関係上、TOTALが100.0%にならない場合があります。
※免許証には制限付き運転免許証と段階的運転免許証が含まれます。
※免許取得年齢:16-18歳(フルライセンス)
引用
U.S. Department of Transportion, Federal Highway Administration
Retrieved February 22, 2023, from here
---
アメリカ人の「平均的な暮らし」を詳しく知りたい方は、こちらの記事も併せてご確認ください。
“平均アメリカ人”はどんな生活?多様化するアメリカ消費者の「平均」を知ろう
・個を重視するアメリカ
・合理性・効率化を求めるアメリカ
・耐久財に対する価値観
など
Reference
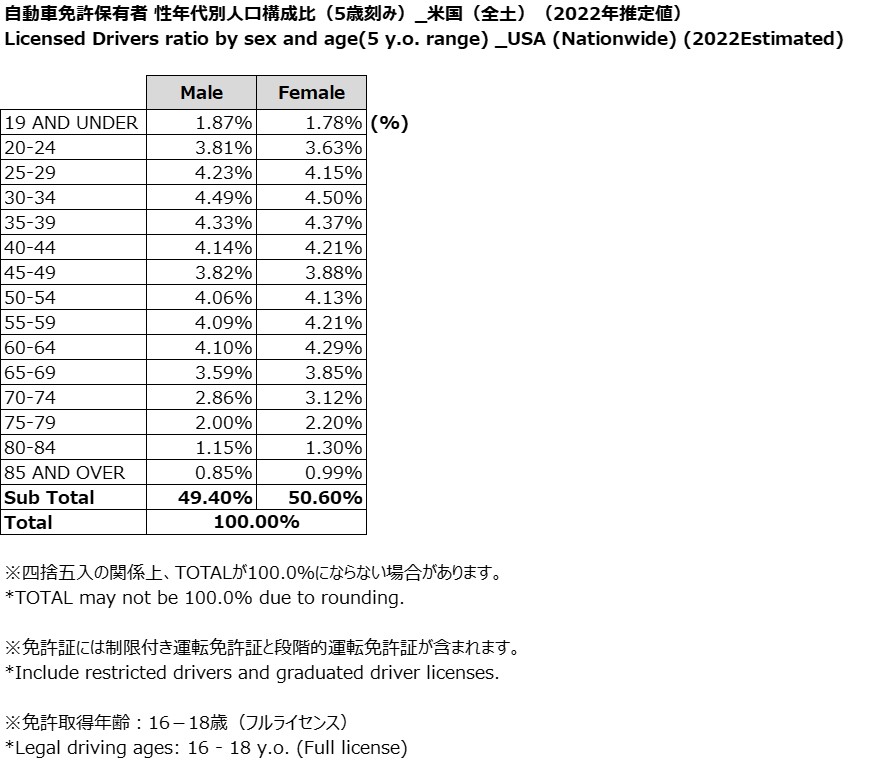
U.S. Department of Transportion, Federal Highway Administration
Retrieved October, 2024, from https://www.fhwa.dot.gov/policyinformation/statistics/2022/dl22.cfm
※四捨五入の関係上、TOTALが100.0%にならない場合があります。
※免許証には制限付き運転免許証と段階的運転免許証が含まれます。
※免許取得年齢:16-18歳(フルライセンス)
U.S. Department of Transportion, Federal Highway Administration
Retrieved February 22, 2023, from here
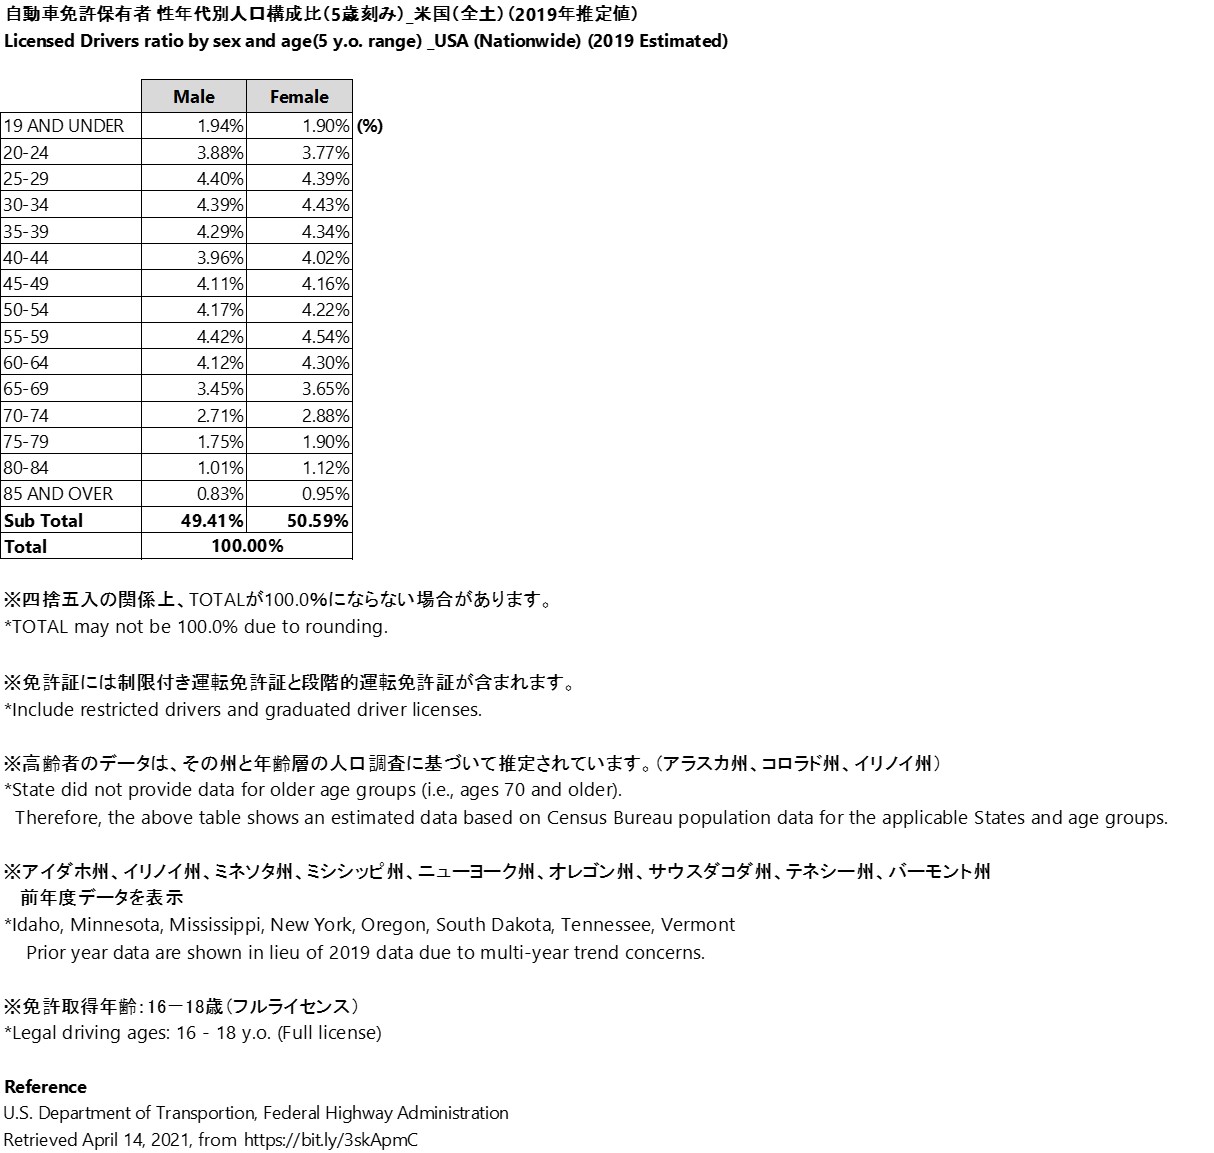
※四捨五入の関係上、TOTALが100.0%にならない場合があります。
※免許証には制限付き運転免許証と段階的運転免許証が含まれます。
※高齢者のデータは、その州と年齢層の人口調査に基づいて推定されています。(アラスカ州、コロラド州、イリノイ州)
※アイダホ州、イリノイ州、ミネソタ州、ミシシッピ州、ニューヨーク州、オレゴン州、サウスダコダ州、テネシー州、バーモント州 前年度データを表示 ※免許取得年齢は、州によって異なります。
U.S. Department of Transportion, Federal Highway Administration Retrieved April 14, 2021, from https://bit.ly/3skApmC
\ 会員登録で無料 /
downloadデータをダウンロード