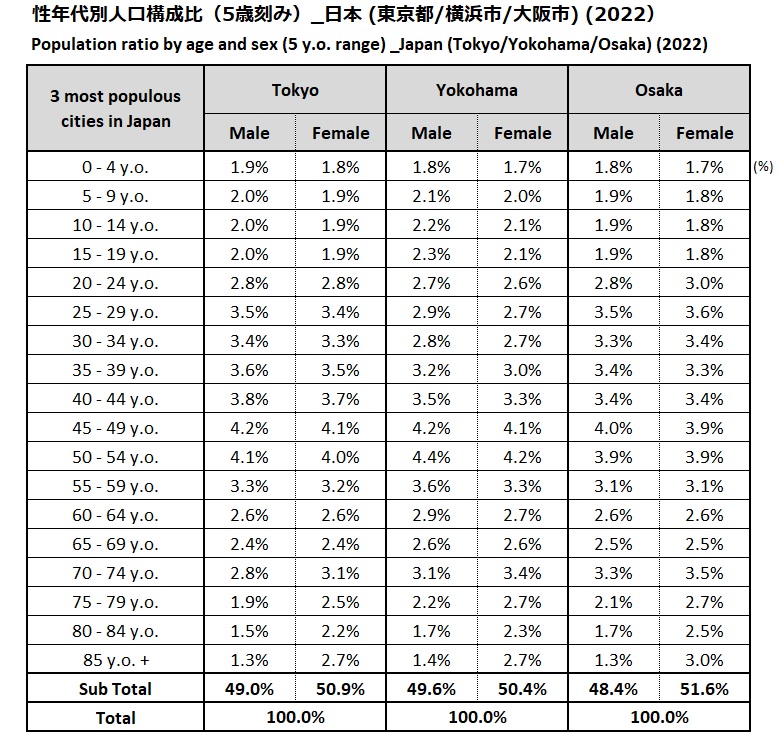
Population ratio by age and sex (5 y.o. range) _Japan (Tokyo/Yokohama/Osaka)
* 3 Cities are listed in descending order according to population from left to right.
* All percentages may not total 100% due to rounding.
Reference
e-Stat Japan, "Population, Demographics and Household Survey based on the Basic Resident Register / Survey Results"
「住民基本台帳に基づく人口、人口動態及び世帯数調査 / 調査の結果 2025年」
Retrieved Aug 14, 2025, from here
* 3 Cities are listed in descending order according to population from left to right.
* All percentages may not total 100% due to rounding.
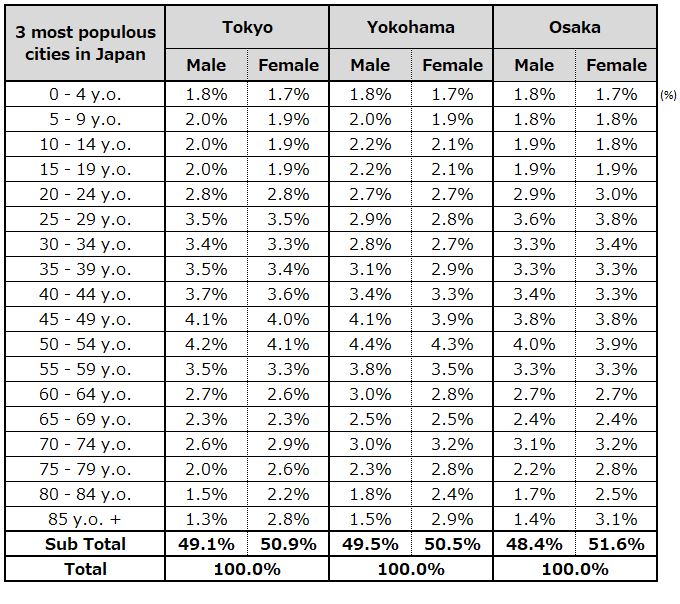
Reference
e-Stat Japan, "Population, Demographics and Household Survey based on the Basic Resident Register / Survey Results"
Retrieved Nov 09, 2023, from here
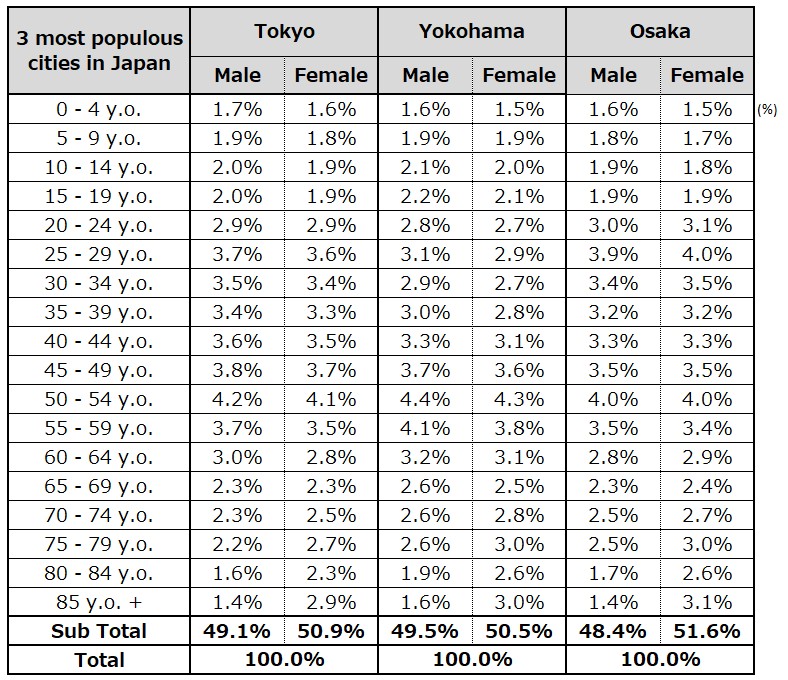
* 3 Cities are listed in descending order according to population from left to right.
* All percentages may not total 100% due to rounding.
e-Stat Japan, "Population, Demographics and Household Survey based on the Basic Resident Register / Survey Results"
Retrieved Dec 26, 2022, from here
- Population
- 1305 Views