Search Results
Income & Expenditure - 35 results
-
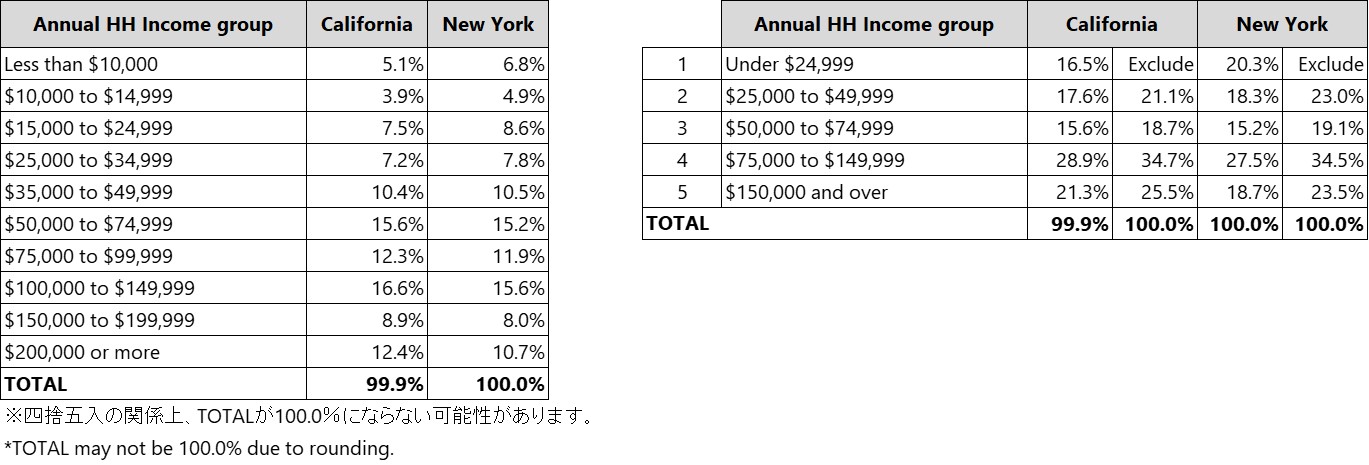
Percentage of households by household income&SEC_USA (by states)
calendar_monthJan 28, 2021
***
-

Usage rate of loans
calendar_monthDec 11, 2020
Q. Do you currently take out any loans under your name? Please select all that apply.。
-

Number of paydays
calendar_monthDec 11, 2020
Q. How many times do you receive a salary in a month ?
-
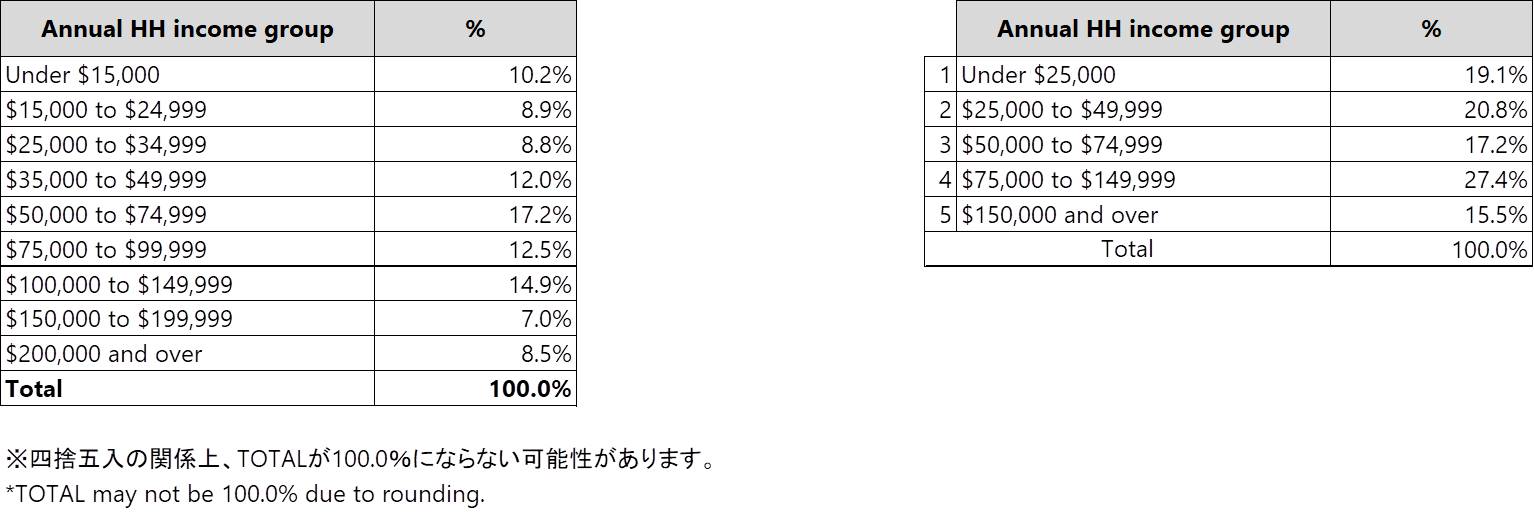
Percentage of households by household income&SEC_USA (Nationwide)
calendar_monthSep 14, 2020
***
-
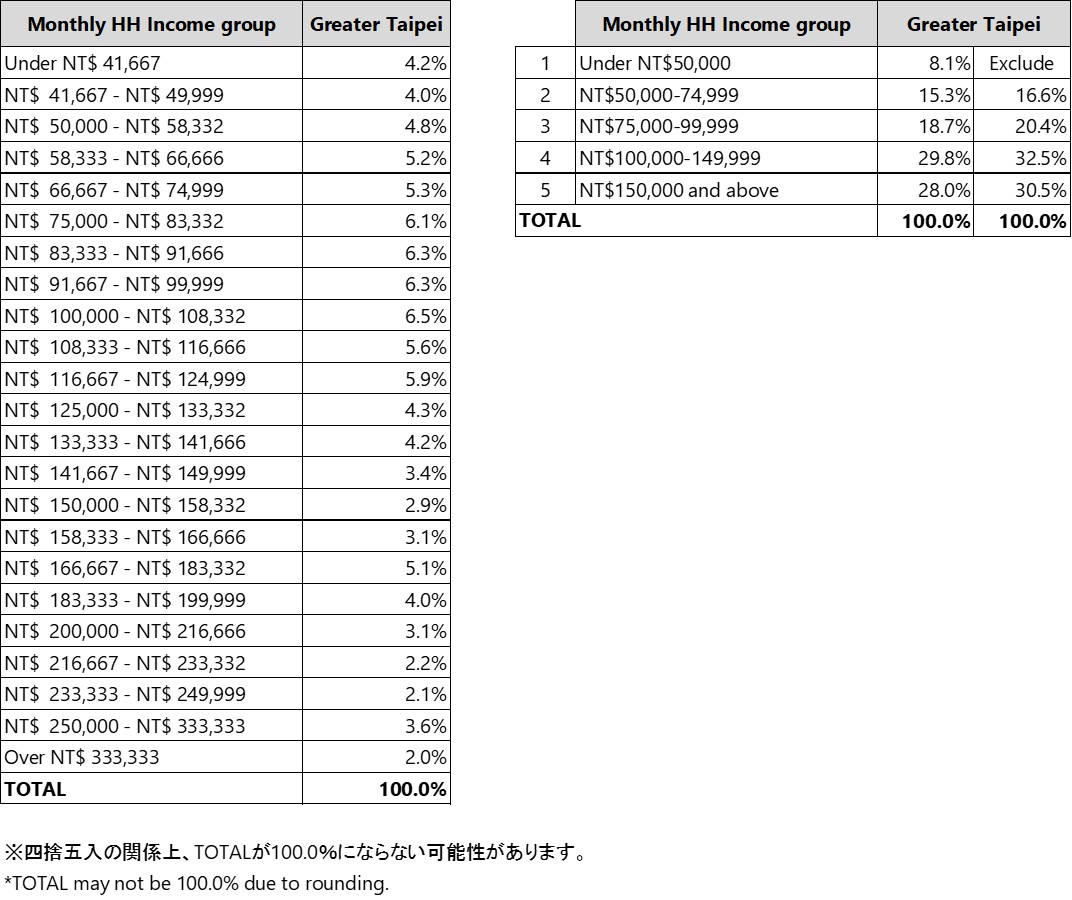
Percentage of households by household income&SEC_Taiwan (Greater Taipei)
calendar_monthSep 11, 2020
****
-
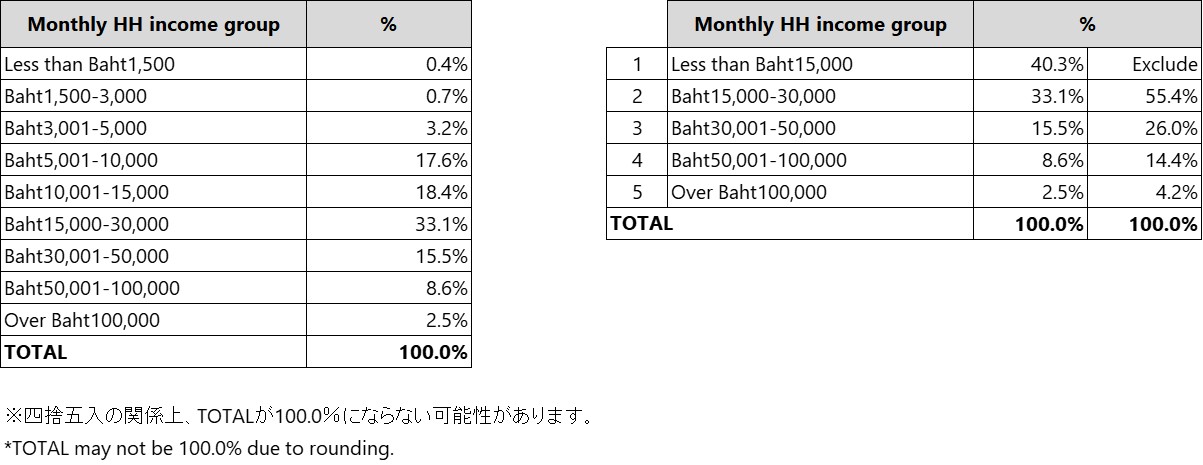
Percentage of households by household income&SEC_Thailand (Nationwide)
calendar_monthSep 11, 2020
***
-
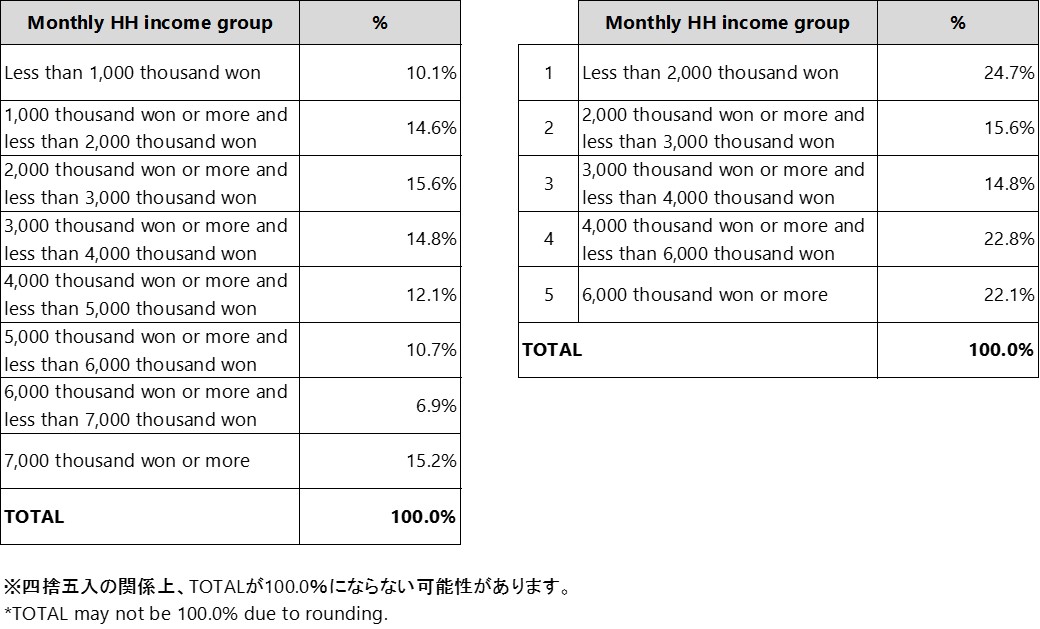
Percentage of households by household income&SEC_Korea(Nationwide))
calendar_monthSep 11, 2020
****
-
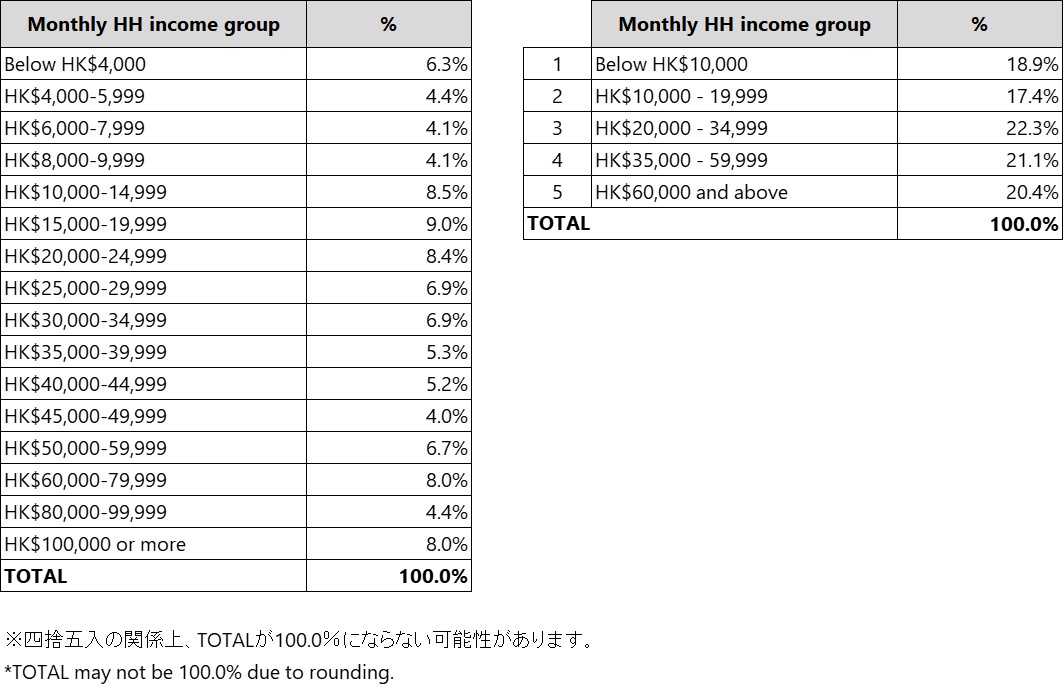
Percentage of households by household income&SEC_Hong Kong (Nationwide)
calendar_monthSep 10, 2020
***
-
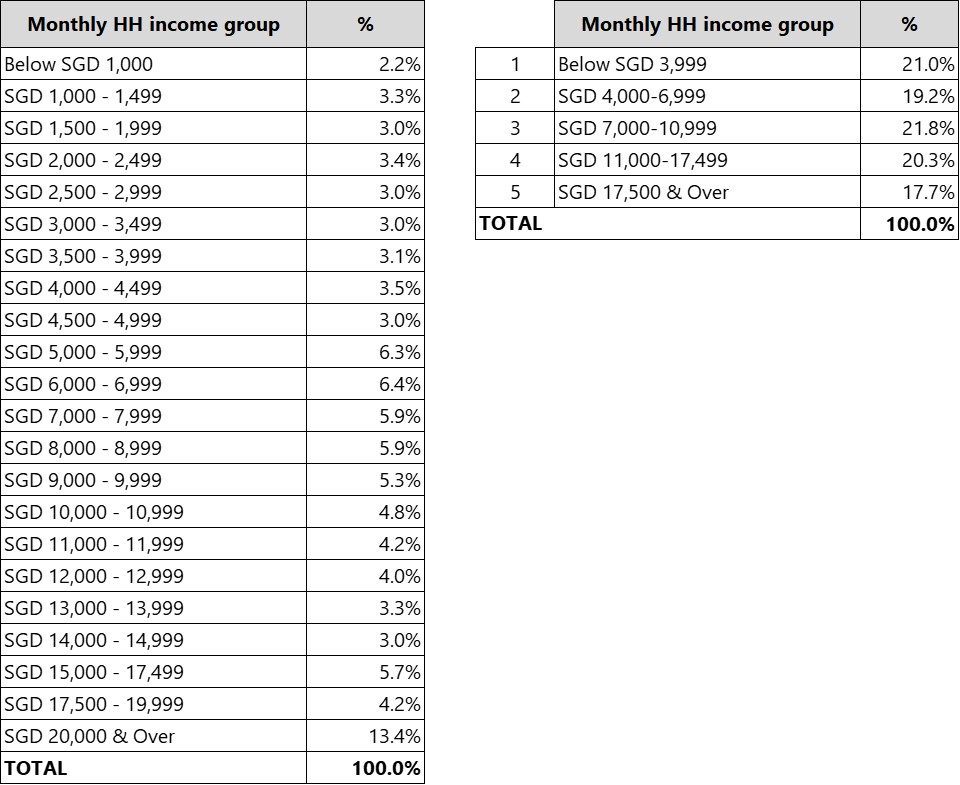
Percentage of households by household income&SEC_Singapore (Nationwide)
calendar_monthSep 10, 2020
***
-
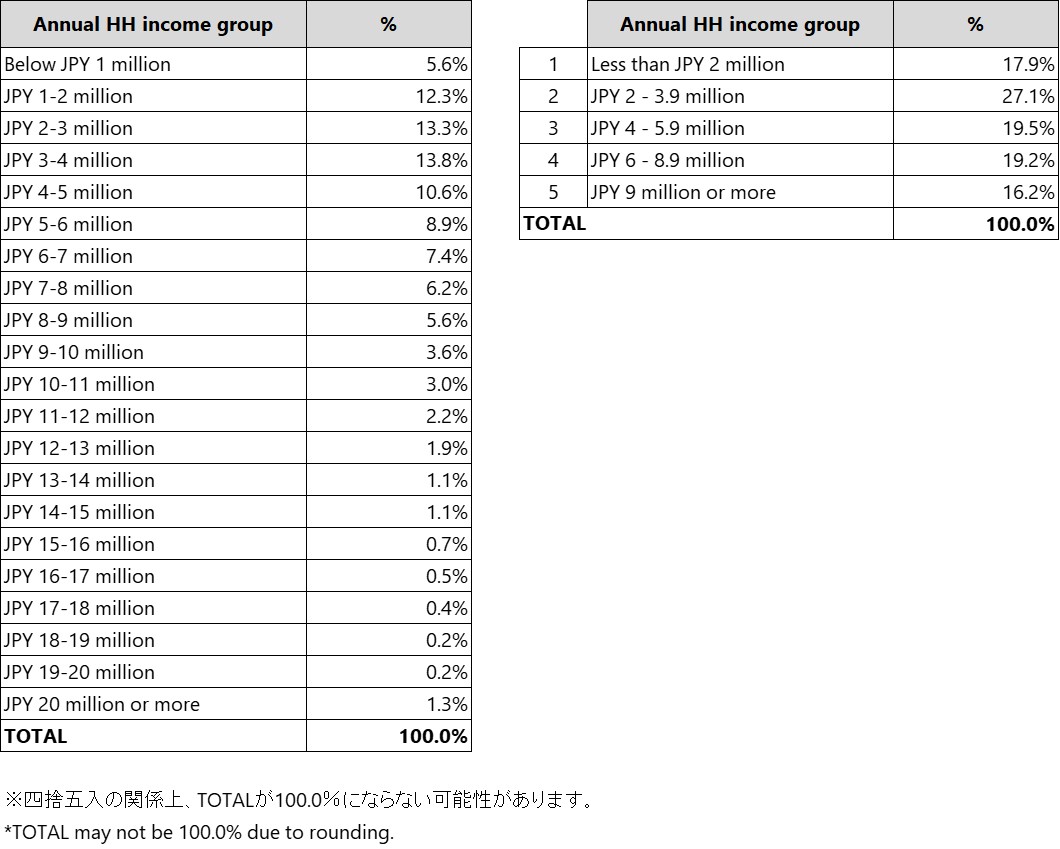
Percentage of households by household income&SEC_Japan (Nationwide)
calendar_monthSep 01, 2020
***
-
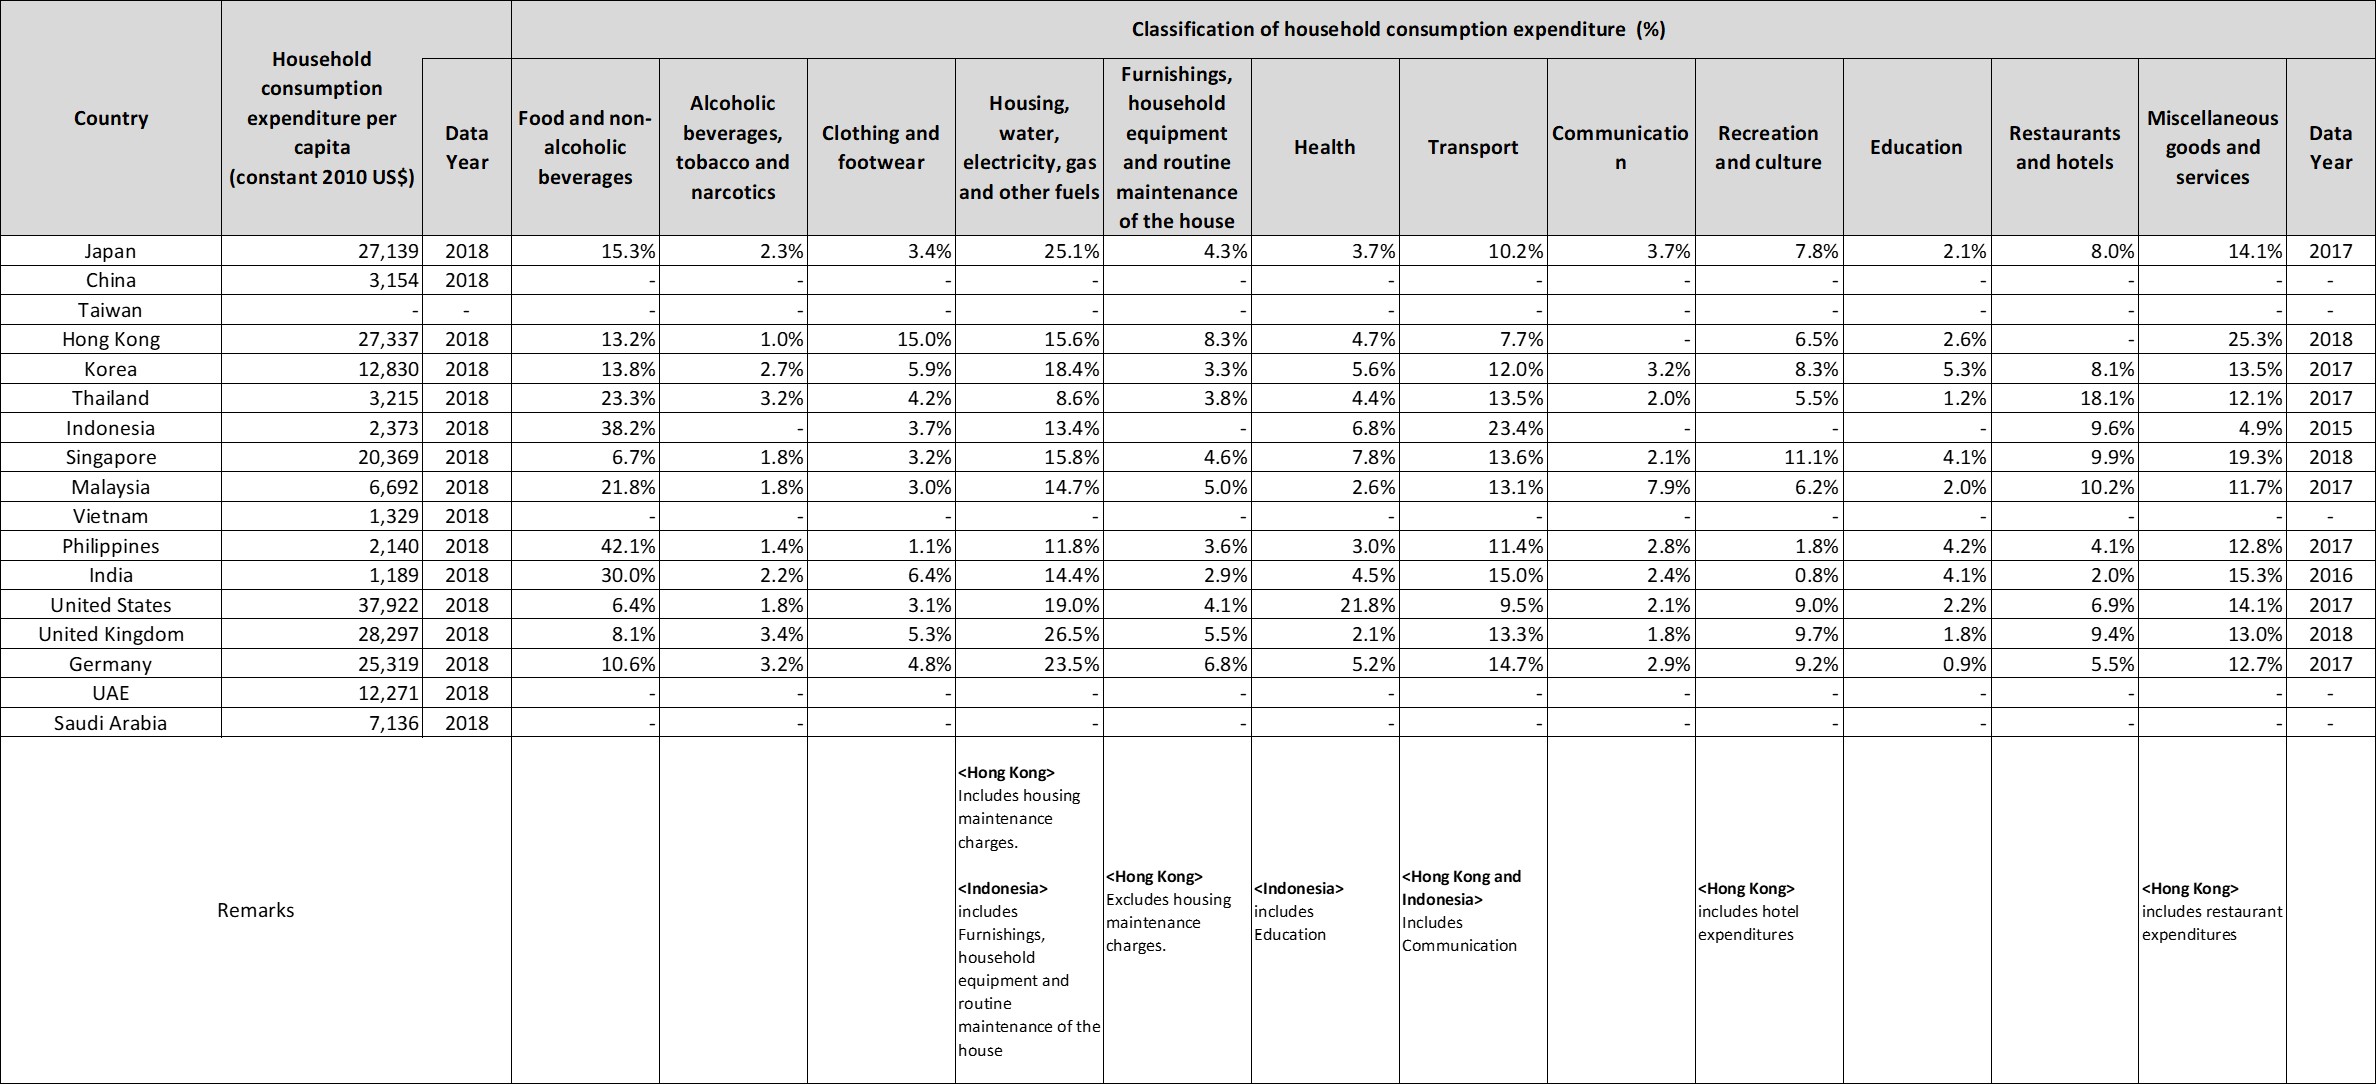
Classification of household consumption expenditure
calendar_monthJul 30, 2020
The U.S. tops the list of annual household consumption expenditures per capita, at $37,922. It is followed by the UK, Hong Kong, Japan and Germany. In terms of the share of household consumption expenditure, the Philippines has more than 40% in the food sector alone. Indonesia and India also have a share of over 30%. On the other hand, in Singapore, the U.S. and the UK, the food sector accounts for less than 10%. Japan, the UK and Germany have the highest share of rent and utility costs, at over 20%. In Thailand, compared to the other countries, the expenditure share of the restaurant and hotel sector is larger at 18% of the total.