Search Results
Population - 138 results
-
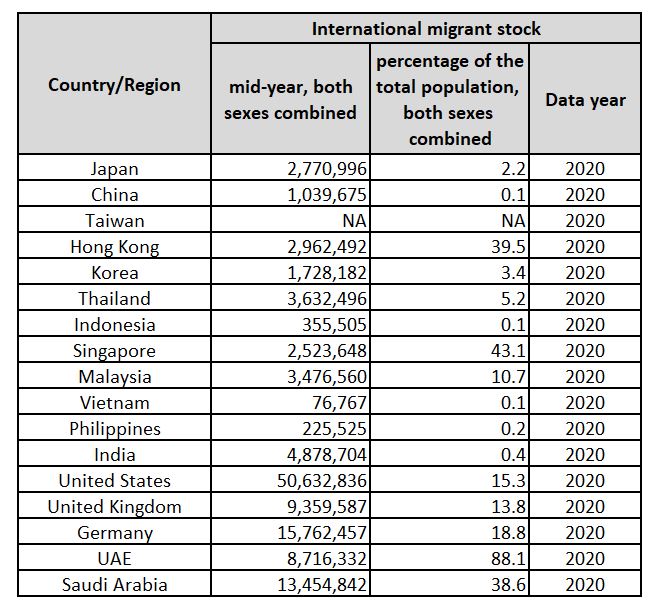
Number of International Migration _16 countries
calendar_monthJun 21, 2024
-In Southeast and East Asia, Singapore (43.1) and Hong Kong (39.5) have high percentages of international immigrants in their total population, around 40%.-In the U.S. (15.3), the U.K. (13.8), and Germany (18.8), the percentage is in the 10% range.-In West Asia, the UAE (88.1) has a very large number of immigrants. Definition of "MigrantAccording to the International Organization for Migration (IOM), "a person who leaves his or her usual place of residence, temporarily or permanently, within or across national borders, for various purposes.https://japan.iom.int/migrant-definition
-
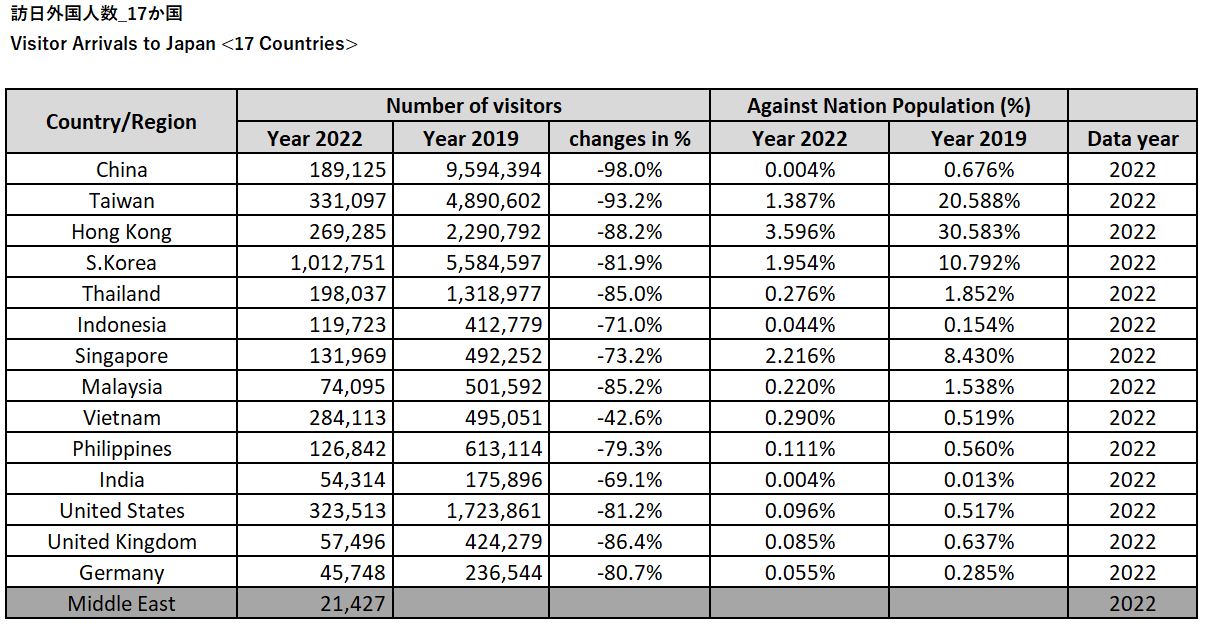
Visitor Arrivals to Japan <14 Countries>
calendar_monthJan 04, 2024
***
-
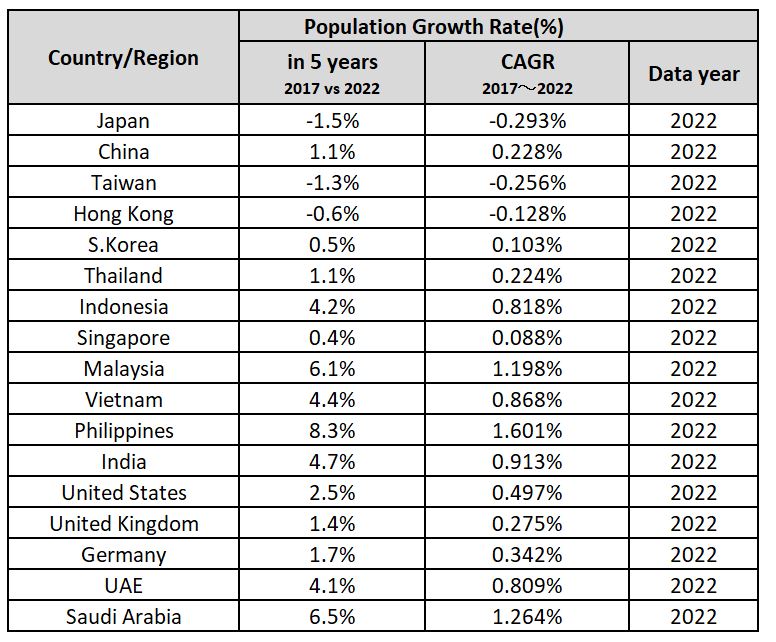
Population Growth Rate per Country
calendar_monthDec 28, 2023
***
-
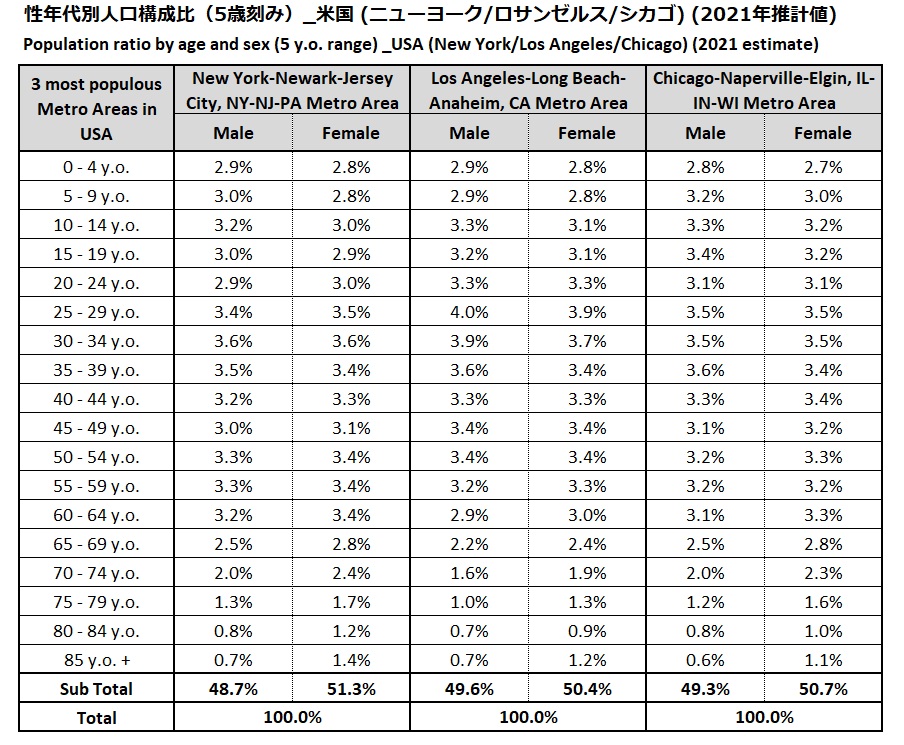
Population ratio by age and sex (5 y.o. range) _USA (New York/Los Angeles/Chicago)
calendar_monthJan 04, 2023
* 4 metropolitan areas are listed in descending order according to population from left to right.* The population composition is calculated based on the population data of each metropolitan area.* All percentages may not total 100% due to rounding.
-
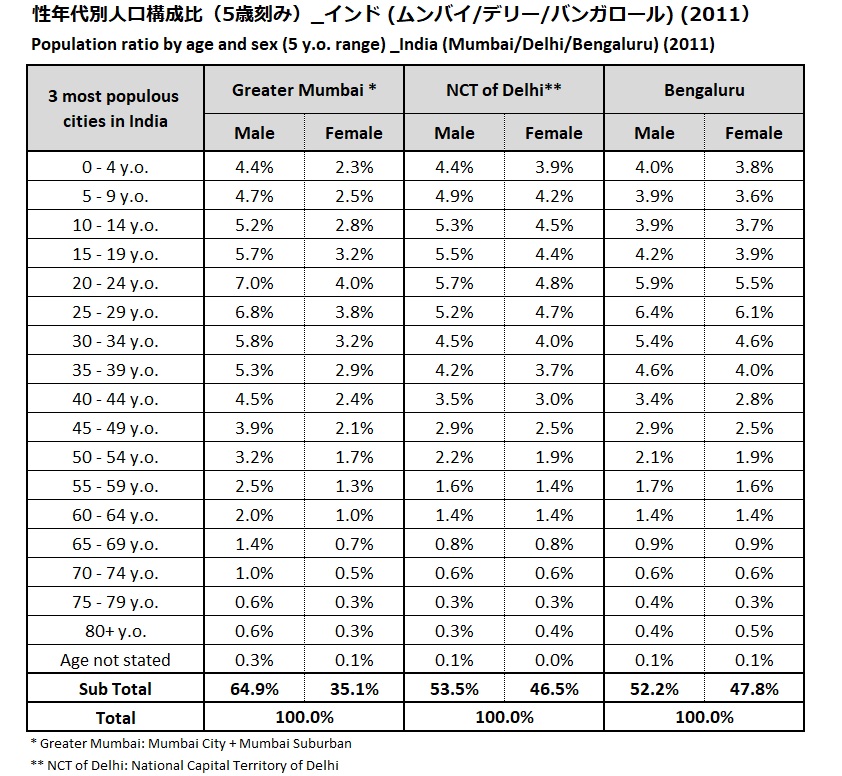
Population ratio by age and sex (5 y.o. range) _India (Mumbai/Delhi/Bengaluru) (2011)
calendar_monthJan 03, 2023
* 3 Cities are listed in descending order according to population from left to right.* All percentages may not total 100% due to rounding.
-
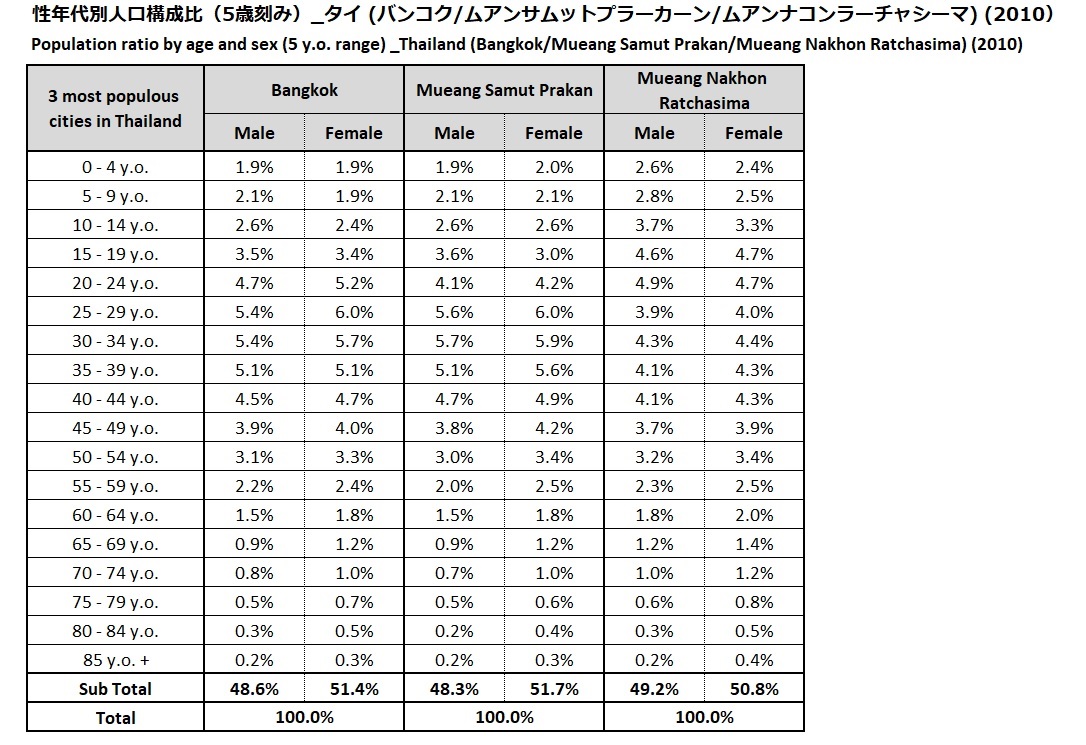
Population ratio by age and sex (5 y.o. range) _Thailand (Bangkok/Mueang Samut Prakan/Mueang Nakhon Ratchasima) (2010)
calendar_monthDec 30, 2022
* 3 Cities are listed in descending order according to population from left to right.* All percentages may not total 100% due to rounding.
-
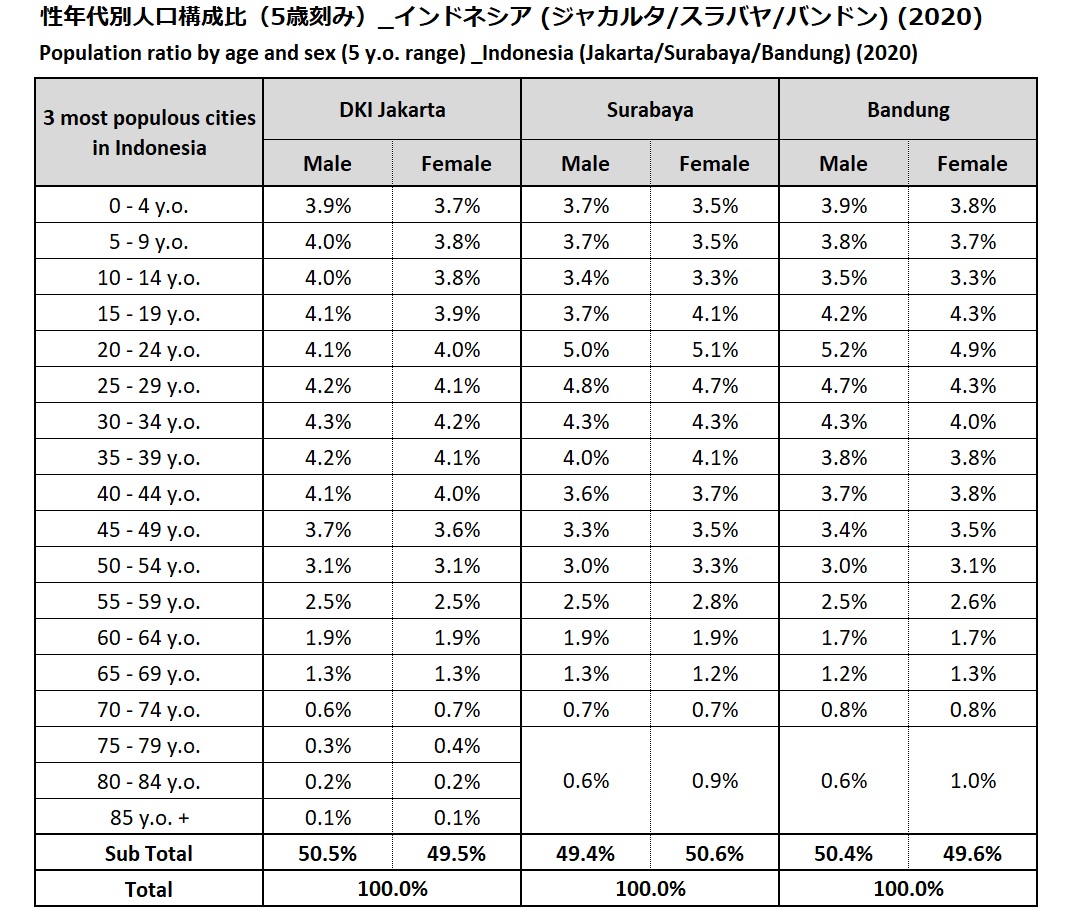
Population ratio by age and sex (5 y.o. range) _Indonesia (Jakarta/Surabaya/Bandung) (2020)
calendar_monthDec 30, 2022
* 3 Cities are listed in descending order according to population from left to right.* All percentages may not total 100% due to rounding.---With the world’s fourth-largest population and sustained GDP growth, Indonesia is Southeast Asia’s largest economy.How well do you understand the “average Indonesian lifestyle and values”?Drawing on various data sources, including Intage’s “Global Viewer” international consumer data, we will organize and explain the “average” that defines Indonesian consumers, as well as the latest trends revealed by this data.Let’s Get to Know the “Average” Indonesian! Understanding the Lifestyle Through Climate, Culture, Halal, and Gen Z・Lifestyle and Living Environment: Differences by Socioeconomic Class (SEC)・Religious and Halal Considerations and Unique Consumer Behavior
-
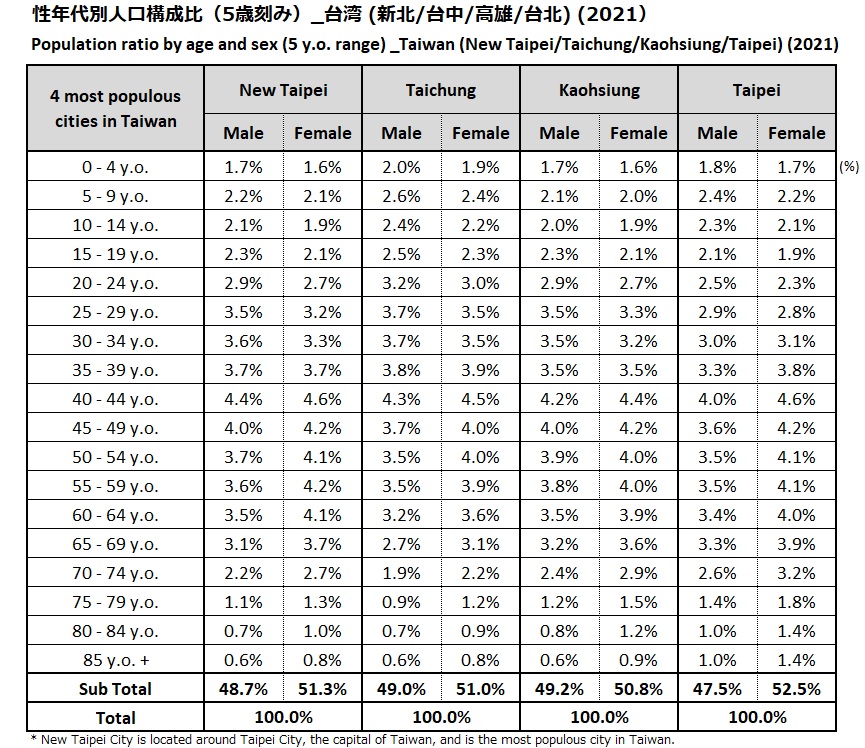
Population ratio by age and sex (5 y.o. range) _Taiwan (New Taipei/Taichung/Kaohsiung/Taipei)
calendar_monthDec 29, 2022
* Chities are listed in descending order according to population from left to right. * All percentages may not total 100% due to rounding
-
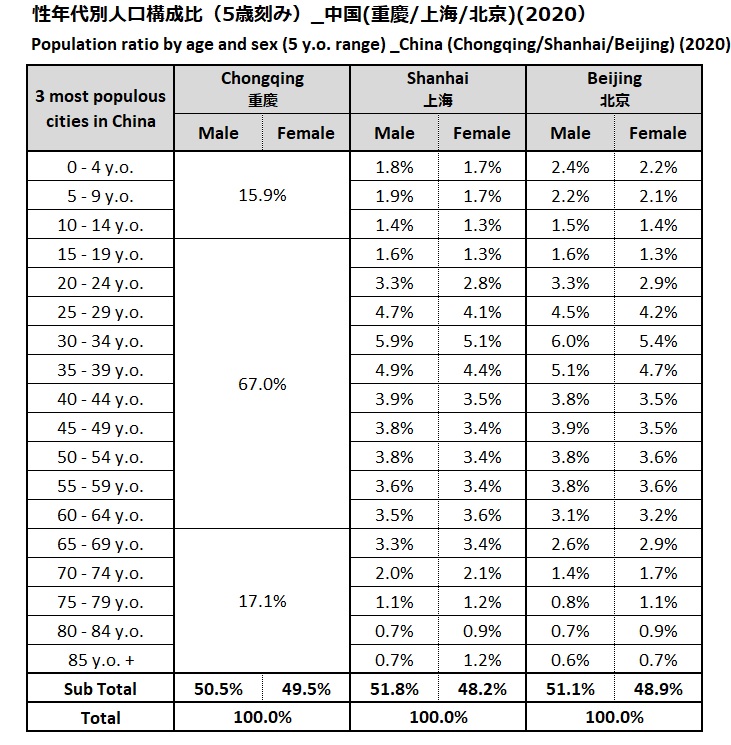
Population ratio by age and sex (5 y.o. range) _China (Chongqing/Shanhai/Beijing) (2020)
calendar_monthDec 29, 2022
* 3 Cities are listed in descending order according to population from left to right.* All percentages may not total 100% due to rounding.--- For those interested in learning more about daily life in China, please also check out this article. What is Real Life in China? Daily Habits and Current Trends Marketers Should Know・Urban Housing Conditions: Surprisingly Not That Spacious? Floor Plans and Features・Ways to Maximize Space Utilization・Refrigerators in the Living Room? And Entranceways: Different Approaches Compared to Japan・Chinese Households Focusing on Indoor Air Qualityetc.
-
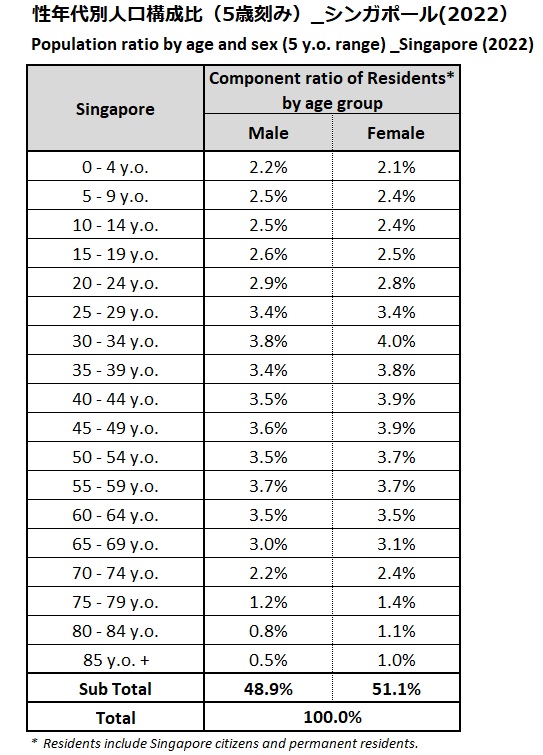
Population ratio by age and sex (5 y.o. range) _Singapore
calendar_monthDec 27, 2022
* All percentages may not total 100% due to rounding
-
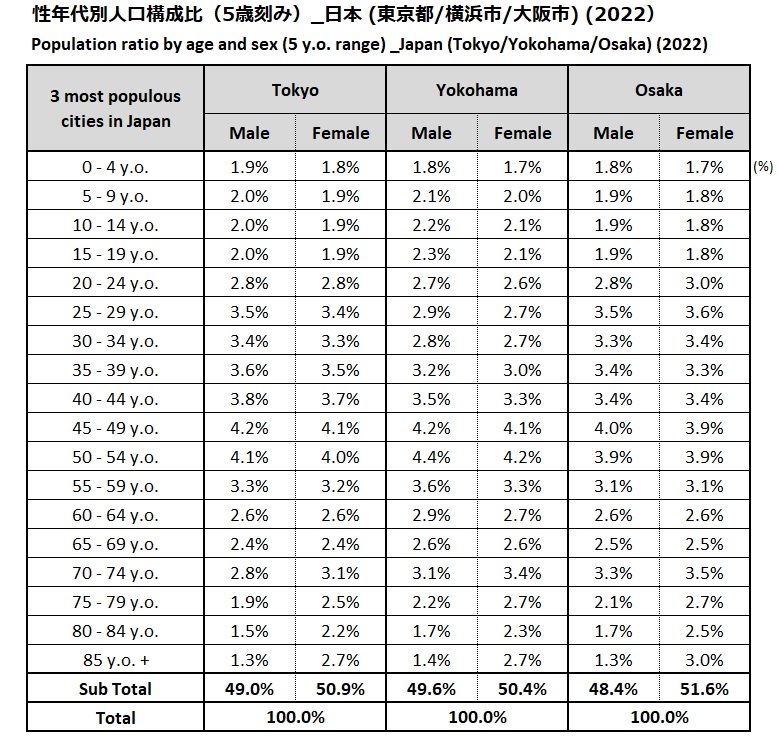
Population ratio by age and sex (5 y.o. range) _Japan (Tokyo/Yokohama/Osaka)
calendar_monthDec 26, 2022
* 3 Cities are listed in descending order according to population from left to right.* All percentages may not total 100% due to rounding.
-
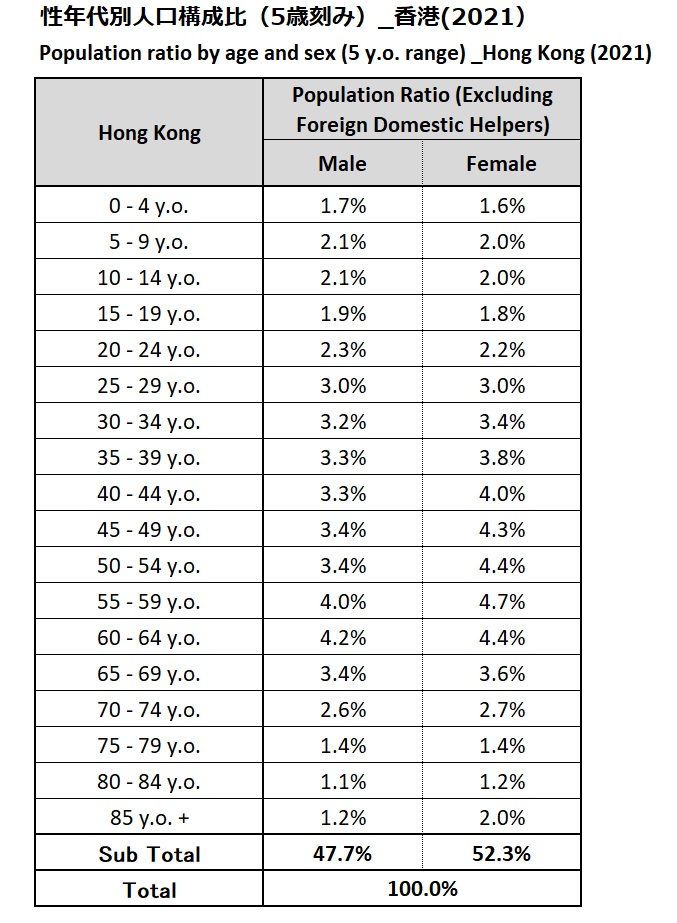
Population ratio by age and sex (5 y.o. range) _Hong Kong (2021)
calendar_monthDec 23, 2022
* All percentages may not total 100% due to rounding