Search Results
消費行動 - 20 results
-
加工食品の購入意向_自分の国(Intage Global Viewer)
- sellGlobal Viewer
calendar_month2026/04/06
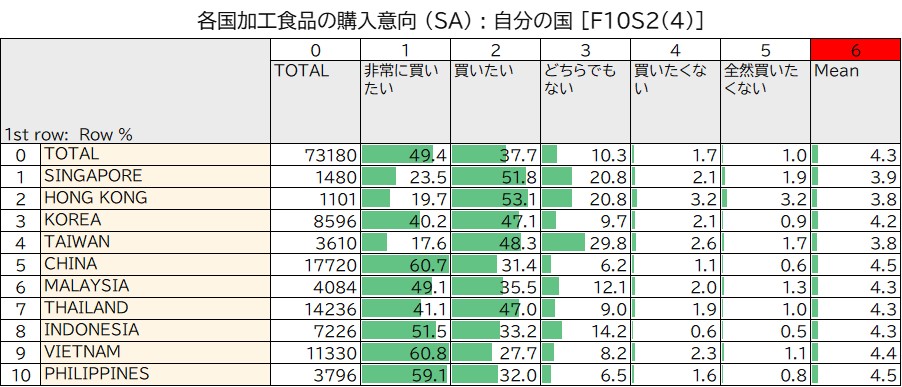
・自分の国の加工食品を「非常に買いたい」「買いたい」と回答する国が総じて多かった。・自分の国の加工食品を「非常に買いたい」と回答した国で一番高かったのは、ベトナム(60.8%)、次いで中国(60.7%)、フィリピン(59.1%)。・自分の国の加工食品の購入意向が「どちらでもない」と回答した国で一番高かったのは、台湾(29.8%)、次いで同率でシンガポール(20.8%)、香港(20.8%)。Intage Global Viewerでは2025/2026の最新データ、または「過去1か月の購入した食材」などのデータも扱っております。詳しくはこちらへ。 各国の家庭料理事情について、もっと詳しく理解したい場合は、以下の記事も併せてご確認ください。 食材の買い足しから片付けまで:アジア8カ国の家庭料理事情私たちの生活に欠かせない「食」。食には、その国の文化・家族構成・インフラ事情が色濃く反映されます。・食材の買い出し、保存習慣・台所の主役の変化・多様化する食卓のタイムマネジメント
-
加工食品の購入意向_アメリカ(Intage Global Viewer)
- sellGlobal Viewer
calendar_month2026/04/06
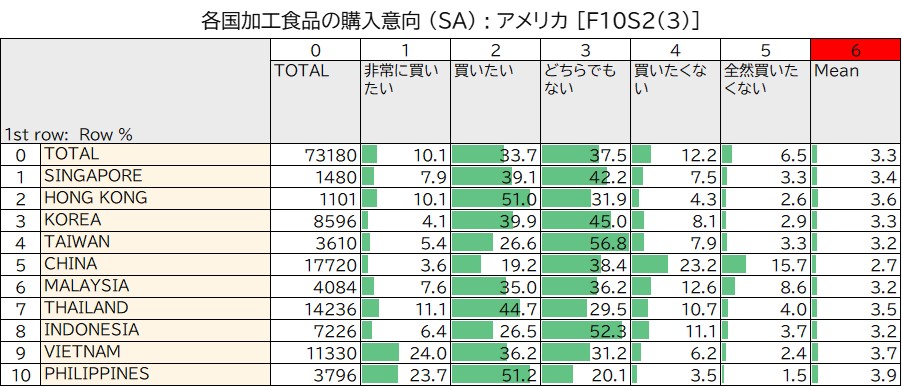
・アメリカの加工食品を「非常に買いたい」と回答した国で一番高かったのは、ベトナム(24.0%)、次いでフィリピン(23.7%)。・アメリカの加工食品を「買いたい」と回答した国で一番高かったのは、フィリピン(51.2%)、次いで香港(51.0%)。・アメリカの加工食品を「買いたくない」と回答した国で一番高かったのは、中国(23.2%)、次いでマレーシア(12.6%)。Intage Global Viewerでは2025/2026の最新データ、または「過去1か月の購入した食材」などのデータも扱っております。詳しくはこちらへ。各国の家庭料理事情について、もっと詳しく理解したい場合は、以下の記事も併せてご確認ください。 食材の買い足しから片付けまで:アジア8カ国の家庭料理事情私たちの生活に欠かせない「食」。食には、その国の文化・家族構成・インフラ事情が色濃く反映されます。・食材の買い出し、保存習慣・台所の主役の変化・多様化する食卓のタイムマネジメント
-
加工食品の購入意向_中国(Intage Global Viewer)
- sellGlobal Viewer
calendar_month2026/04/06
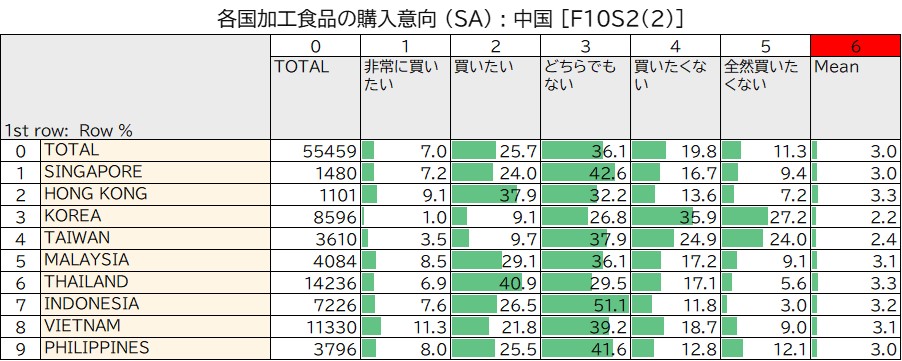
・中国の加工食品を「買いたい」と回答した国で一番高かったのは、タイ(40.9%)、次いで香港(37.9%)・中国の加工食品を「全然買いたくない」と回答した国で一番高かったのは、韓国(27.2%)、次いで台湾(24.0%)。・中国の加工食品の購入意向が「どちらでもない」と回答した国で一番高かったのは、インドネシア(51.1%)、次いでシンガポール(42.6%)。Intage Global Viewerでは2025/2026の最新データ、または「過去1か月の購入した食材」などのデータも扱っております。詳しくはこちらへ。各国の家庭料理事情について、もっと詳しく理解したい場合は、以下の記事も併せてご確認ください。食材の買い足しから片付けまで:アジア8カ国の家庭料理事情私たちの生活に欠かせない「食」。食には、その国の文化・家族構成・インフラ事情が色濃く反映されます。・食材の買い出し、保存習慣・台所の主役の変化・多様化する食卓のタイムマネジメント
-
加工食品の購入意向_日本(Intage Global Viewer)
- sellGlobal Viewer
calendar_month2026/04/06
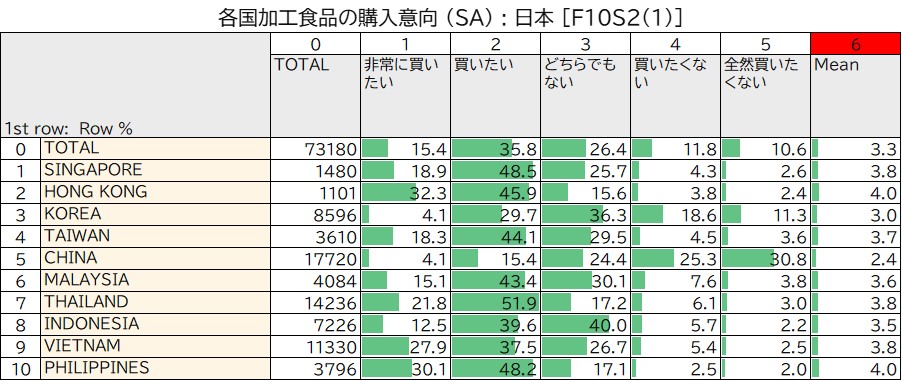
・日本の加工食品を「非常に買いたい」と回答した国で一番高かったのは、香港(32.3%)、次いでフィリピン(30.1%)。・日本の加工食品を「買いたい」と回答した国で一番高かったのは、タイ(51.9%)、次いでシンガポール(48.5%)、フィリピン(48.2%)。・日本の加工食品を「全然買いたくない」と回答した国で一番高かったのは、中国(30.8%)、次いで韓国(11.3%)。Intage Global Viewerでは2025/2026の最新データ、または「過去1か月の購入した食材」などのデータも扱っております。詳しくはこちらへ。各国の家庭料理事情について、もっと詳しく理解したい場合は、以下の記事も併せてご確認ください。食材の買い足しから片付けまで:アジア8カ国の家庭料理事情私たちの生活に欠かせない「食」。食には、その国の文化・家族構成・インフラ事情が色濃く反映されます。・食材の買い出し、保存習慣・台所の主役の変化・多様化する食卓のタイムマネジメント
-
平日の自炊頻度_昼食(Intage Global Viewer)
- sellGlobal Viewer
calendar_month2026/04/06
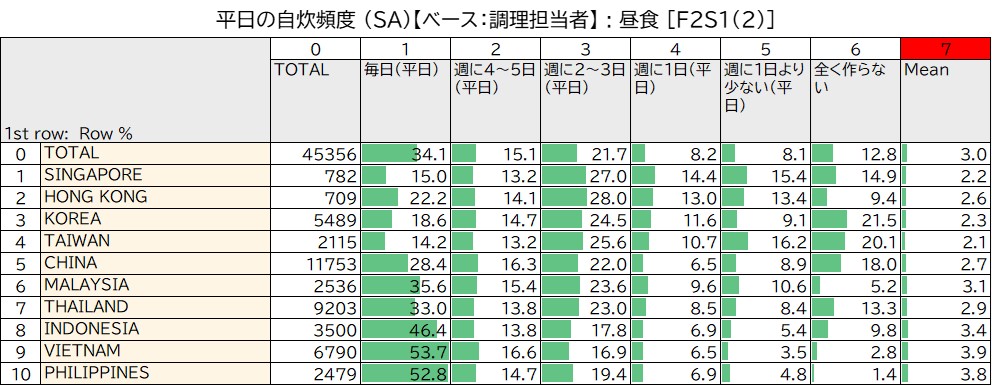
・平日の昼食を「毎日」自炊すると回答した中で一番多かった国は、べトナム(53.7%)次いでフィリピン(52.8%)、インドネシア(46.4%)。・「週に2~3日」自炊すると回答した中で一番多かった国は、香港(28.0%)。・「全く作らない」と回答した中で一番多かった国は、韓国(21.5%)、次いで台湾(20.1%)。Intage Global Viewerでは2025/2026の最新データ、または「休日の自炊頻度」などのデータも扱っております。詳しくはこちらへ。各国の家庭料理事情について、もっと詳しく理解したい場合は、以下の記事も併せてご確認ください。食材の買い足しから片付けまで:アジア8カ国の家庭料理事情私たちの生活に欠かせない「食」。食には、その国の文化・家族構成・インフラ事情が色濃く反映されます。・食材の買い出し、保存習慣・台所の主役の変化・多様化する食卓のタイムマネジメント
-
平日の自炊頻度_夕食(Intage Global Viewer)
- sellGlobal Viewer
calendar_month2026/04/06
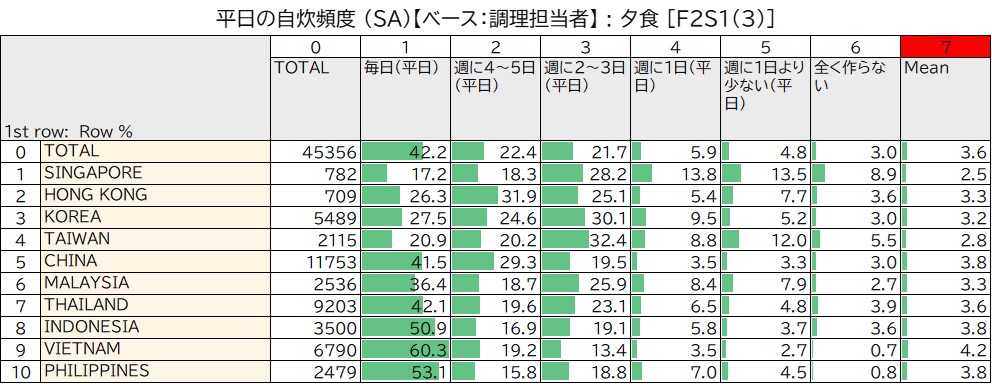
・平日の夕食を「毎日」自炊すると回答した中で一番多かった国は、ベトナム(60.3%)。次いでフィリピン(53.1%)、インドネシア(50.9%)。・「週に2~3日」自炊すると回答した中で一番多かった国は、台湾(32.4%)、次いで韓国(30.1%)。・「週に1日(平日)」と回答した中で一番多かった国は、シンガポール(13.8%)。Intage Global Viewerでは2025/2026の最新データ、または「休日の自炊頻度」などのデータも扱っております。詳しくはこちらへ。各国の家庭料理事情について、もっと詳しく理解したい場合は、以下の記事も併せてご確認ください。食材の買い足しから片付けまで:アジア8カ国の家庭料理事情私たちの生活に欠かせない「食」。食には、その国の文化・家族構成・インフラ事情が色濃く反映されます。・食材の買い出し、保存習慣・台所の主役の変化・多様化する食卓のタイムマネジメント
-
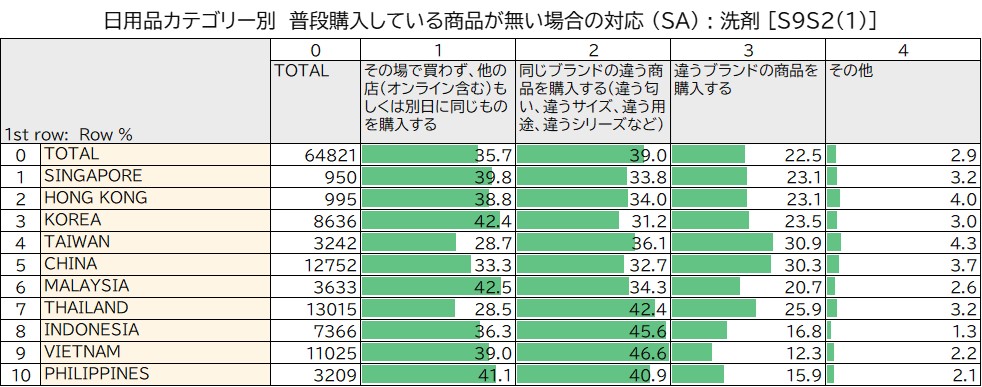
普段購入している日用品(洗剤)が無い場合の対応(Intage Global Viewer)
- sellGlobal Viewer
calendar_month2026/04/03
・「同じブランドの違う商品を購入する(違う匂い、違うサイズ、違う用途、違うシリーズなど)」と回答した中で一番高い国は、ベトナム(46.6%)、次いでインドネシア(45.6%)、タイ(42.4%)。・「その場で買わず、他の店(オンライン含む)もしくは別日に同じものを購入する」と回答した中で一番高い国は、マレーシア(42.5%)、次いで韓国(42.4%)、フィリピン(41.1%)。・「違うブランドの商品を購入する」と回答した中で一番高い国は、台湾(30.9%)、次いで中国(30.3%)。Intage Global Viewerでは2025/2026の最新データ、または「掃除器具と芳香剤」などのデータも扱っております。詳しくはこちらへ。 洗濯習慣に関する記事として、以下も併せてご確認ください。 【日本・韓国】便利な「半屋外ベランダ」とは?日本と韓国の洗濯習慣の違い洗濯機置き場や、干し方、洗剤の保管場所など、日本と韓国の違いを紹介します。・洗濯機の設置場所・洗濯物の干し方・洗剤の保管場所
-
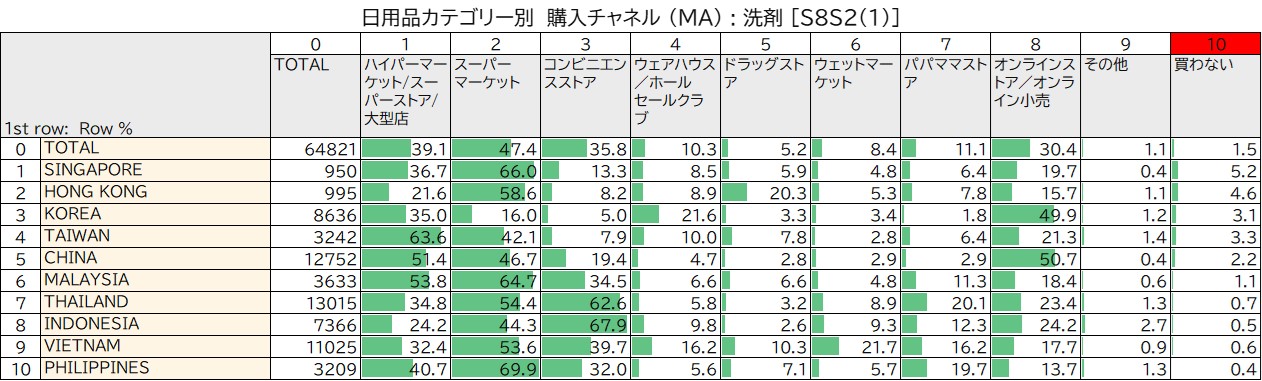
日用品(洗剤)の購入チャネル(Intage Global Viewer)
- sellGlobal Viewer
calendar_month2026/04/03
・「スーパーマーケット」で購入するのが一番多い国は、フィリピン(69.9%)、次いでシンガポール(66.0%)、マレーシア(64.7%)。・「コンビニエンスストア」で購入するのが一番多い国は、インドネシア(67.9%)、次いでタイ(62.6%)。・「オンラインストア/オンライン小売」で購入するのが一番多い国は、中国(50.7%)、次いで韓国(49.9%)。Intage Global Viewerでは2025/2026の最新データ、または「掃除器具と芳香剤の購入チャネル」などのデータも扱っております。詳しくはこちらへ。 洗濯習慣に関する記事として、以下も併せてご確認ください。 【日本・韓国】便利な「半屋外ベランダ」とは?日本と韓国の洗濯習慣の違い洗濯機置き場や、干し方、洗剤の保管場所など、日本と韓国の違いを紹介します。・洗濯機の設置場所・洗濯物の干し方・洗剤の保管場所
-
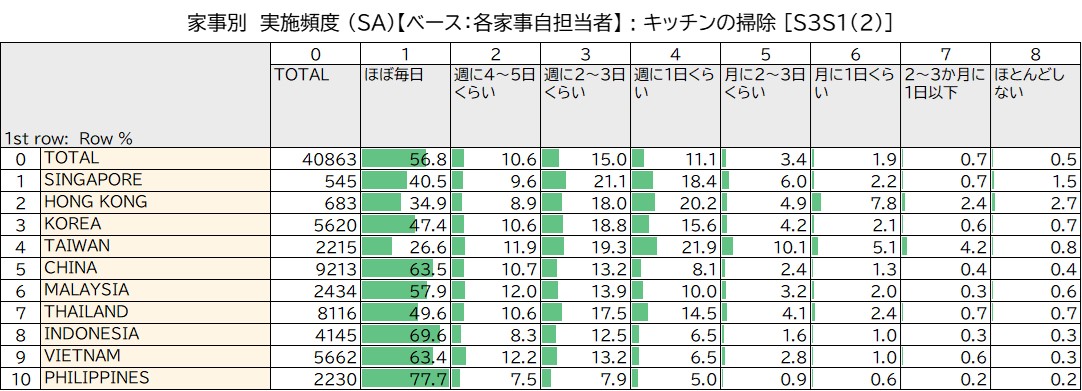
掃除の頻度・キッチン(Intage Global Viewer)
- sellGlobal Viewer
calendar_month2026/04/02
・全ての国で、「ほぼ毎日」キッチンの掃除を実施するが一番高かった。最も高かったのはフィリピン(77.7%)、次いでインドネシア(69.6%)。・台湾の中では「ほぼ毎日」が一番高かったが、26.6%で他の国と比較すると低い。一方で、「週に1日くらい」の回答が21.9%と他の国より高かった。Intage Global Viewerでは2025/2026の最新データ、または「洗濯、食器洗い、その他スペースの掃除頻度」などのデータも扱っております。詳しくはこちらへ。住環境と掃除事情に関する記事として、以下も併せてご確認ください。【中国:地球の暮らし方】中国住宅の住環境と掃除事情中国と日本の掃除道具と掃除の仕方の違いについて紹介します。・空間ごとに違う床材・掃除の順番と使用する道具
-
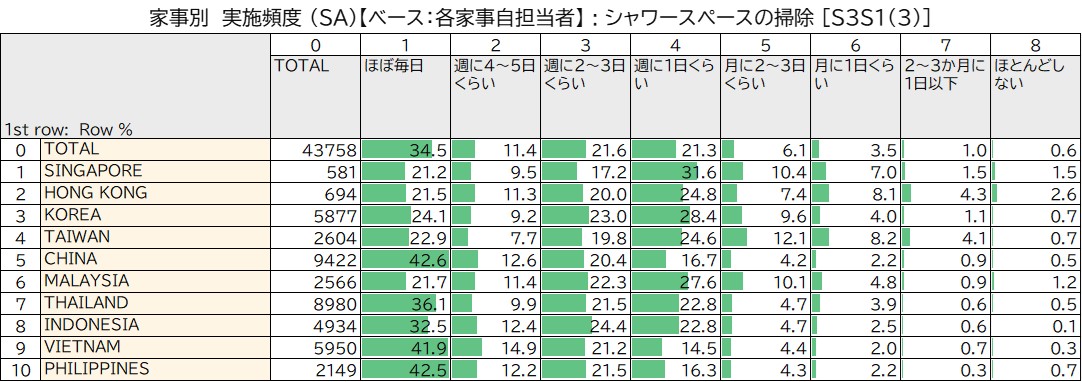
掃除の頻度・シャワースペース(Intage Global Viewer)
- sellGlobal Viewer
calendar_month2026/04/02
・「ほぼ毎日」「週に2~3日くらい」「週に1日くらい」の頻度でシャワースペースを掃除している傾向がある。・「ほぼ毎日」が最も高かったのは、中国(42.6%)、次いでフィリピン(42.5%)、ベトナム(41.9%)。・「週に1日くらい」が最も高かったのは、シンガポール(31.6%)、次いで韓国(28.4%)、マレーシア(27.6%)。 Intage Global Viewerでは2025/2026の最新データ、または「洗濯、食器洗い、その他スペースの掃除頻度」などのデータも扱っております。詳しくはこちらへ。住環境と掃除事情に関する記事として、以下も併せてご確認ください。【中国:地球の暮らし方】中国住宅の住環境と掃除事情中国と日本の掃除道具と掃除の仕方の違いについて紹介します。・空間ごとに違う床材・掃除の順番と使用する道具
-
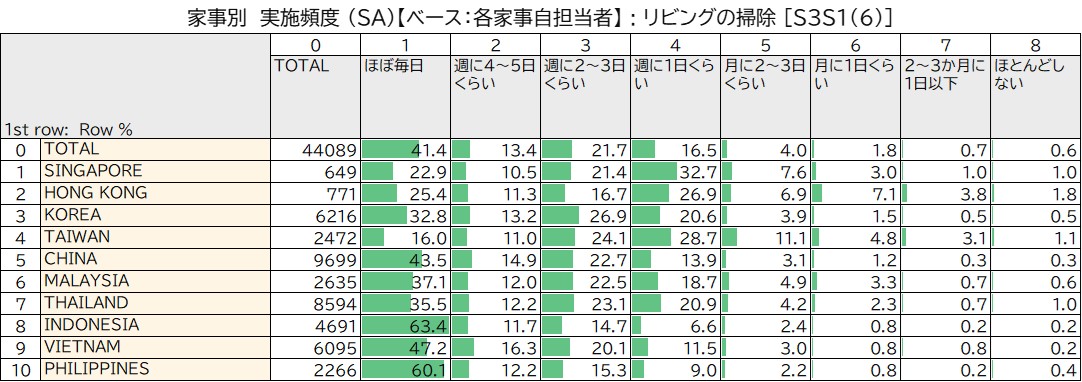
掃除の頻度・リビング(Intage Global Viewer)
- sellGlobal Viewer
calendar_month2026/04/02
・「ほぼ毎日」「週に2~3日くらい」「週に1日くらい」の頻度でリビングを掃除している傾向がある。・「ほぼ毎日」が最も高かったのは、インドネシア(63.4%)、次いでフィリピン(60.1%)。・「週に1日くらい」が最も高かったのは、シンガポール(32.7%)、次いで台湾(28.7%)、香港(26.9%)。Intage Global Viewerでは2025/2026の最新データ、または「洗濯、食器洗い、その他スペースの掃除頻度」などのデータも扱っております。詳しくはこちらへ。住環境と掃除事情に関する記事として、以下も併せてご確認ください。【中国:地球の暮らし方】中国住宅の住環境と掃除事情中国と日本の掃除道具と掃除の仕方の違いについて紹介します。・空間ごとに違う床材・掃除の順番と使用する道具
-
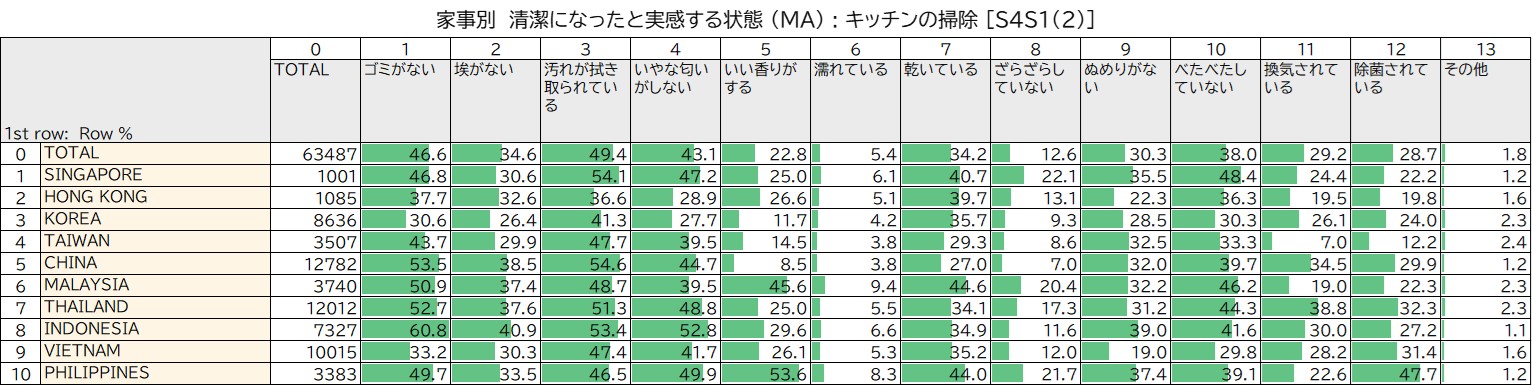
清潔になったと実感する状態・キッチン(Intage Global Viewer)
- sellGlobal Viewer
calendar_month2026/04/02
・「ゴミがない」状態が最も高かったのは、インドネシア(60.8%)。・「いい香りがする」状態が最も高かったのは、フィリピン(53.6%)、次いでマレーシア(45.6%)。・「除菌されている」状態が最も高かったのは、フィリピン(47.7%)、次いでタイ(32.3%)。Intage Global Viewerでは2025/2026の最新データ、または「洗濯、食器洗い、その他スペースの状態」などのデータも扱っております。詳しくはこちらへ。 清潔になったと実感する調査に関する記事として、以下も併せてご確認ください。 【アジア各国のZ世代】「いい香り」を大切にするフィリピンZ世代フィリピン人は自分たちのことを「綺麗好きな国民」と言うことが多い中、清潔に対する意識について紹介します。・フィリピンの住宅事情・メイドの掃除スタイル・香りへのこだわり