Search Results
sellTag: Global Viewer - 22 results
-
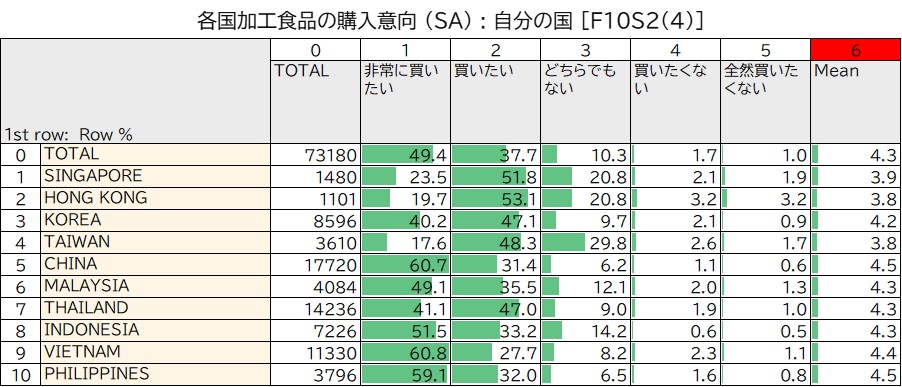
Intent to Purchase Processed Foods_Own Country (Intage Global Viewer)
- sellGlobal Viewer
calendar_monthApr 06, 2026
・Overall, many countries reported that consumers were “very likely” or “likely” to purchase processed foods from their own country.・Among countries where consumers reported being “very likely” to purchase processed foods from their own country, Vietnam had the highest percentage (60.8%), followed by China (60.7%) and the Philippines (59.1%).・Among countries where respondents answered “neither” regarding their intention to purchase processed foods from their own country, Taiwan had the highest percentage (29.8%), followed by Singapore and Hong Kong, which tied at 20.8%.Intage Global Viewer provides the latest data for 2025/2026, as well as data on “food ingredients purchased in the past month” and more.Click here for details. If you’d like to gain a deeper understanding of home cooking trends in various countries, please also check out the following article. From Stocking Up on Ingredients to Cleaning Up: Home Cooking in 8 Asian Countries ~Three Trends Revealed Through Food Culture~Food is an essential part of our lives. It strongly reflects a country’s culture, family structure, and infrastructure.・Grocery shopping and food storage habits・Changes in the kitchen’s main role・Time management for increasingly diverse meals
-
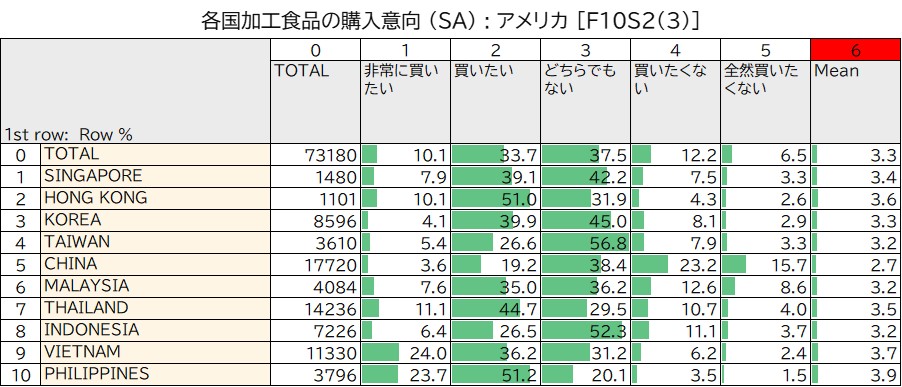
Intent to Purchase Processed Foods_United States (Intage Global Viewer)
- sellGlobal Viewer
calendar_monthApr 06, 2026
・Vietnam had the highest percentage of respondents who said they were “very interested in buying” U.S. processed foods (24.0%), followed by the Philippines (23.7%).・The country with the highest percentage of respondents who said they “want to buy” American processed foods was the Philippines (51.2%), followed by Hong Kong (51.0%).・The country with the highest percentage of respondents who said they “do not want to buy” U.S. processed foods was China (23.2%), followed by Malaysia (12.6%).Intage Global Viewer provides the latest data for 2025/2026, as well as data on “groceries purchased in the past month” and more.Click here for details. If you’d like to gain a deeper understanding of home cooking trends in various countries, please also check out the following article. From Stocking Up on Ingredients to Cleaning Up: Home Cooking in 8 Asian Countries ~Three Trends Revealed Through Food Culture~Food is an essential part of our lives. It strongly reflects a country’s culture, family structure, and infrastructure.・Grocery shopping and food storage habits・Changes in the kitchen’s main role・Time management for increasingly diverse dining experiences
-
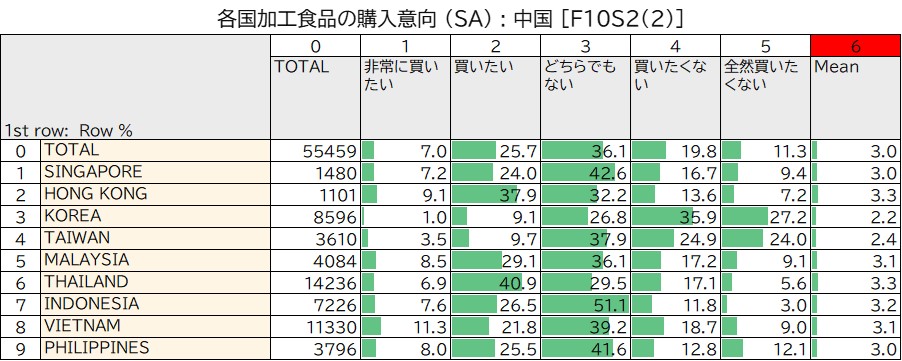
Intent to Purchase Processed Foods_China (Intage Global Viewer)
- sellGlobal Viewer
calendar_monthApr 06, 2026
・The country with the highest percentage of respondents who said they “want to buy” Chinese processed foods was Thailand (40.9%), followed by Hong Kong (37.9%).・The country with the highest percentage of respondents who said they “definitely do not want to buy” Chinese processed foods was South Korea (27.2%), followed by Taiwan (24.0%).・The country with the highest percentage of respondents who answered “neither” regarding their intention to purchase Chinese processed foods was Indonesia (51.1%), followed by Singapore (42.6%).Intage Global Viewer also provides the latest data for 2025/2026, as well as data on “food ingredients purchased in the past month” and more.Click here for details. If you’d like to gain a deeper understanding of home cooking trends in various countries, please also check out the following article. From Stocking Up on Ingredients to Cleaning Up: Home Cooking in 8 Asian Countries ~Three Trends Revealed Through Food Culture~Food is an essential part of our lives. It strongly reflects a country’s culture, family structure, and infrastructure.・Grocery shopping and food storage habits・Changes in the kitchen’s main role・Time management for increasingly diverse meals
-
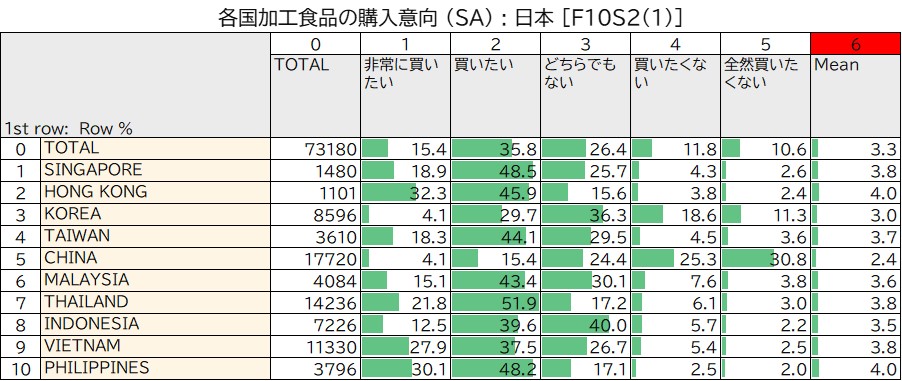
Intent to Purchase Processed Foods_Japan (Intage Global Viewer)
- sellGlobal Viewer
calendar_monthApr 06, 2026
・The country with the highest percentage of respondents who said they “definitely want to buy” Japanese processed foods was Hong Kong (32.3%), followed by the Philippines (30.1%).・The country with the highest percentage of respondents who said they “want to buy” Japanese processed foods was Thailand (51.9%), followed by Singapore (48.5%) and the Philippines (48.2%).・The country with the highest percentage of respondents who said they “definitely do not want to buy” Japanese processed foods was China (30.8%), followed by South Korea (11.3%).Intage Global Viewer provides the latest data for 2025/2026, as well as data on “food ingredients purchased in the past month” and more.Click here for details. If you’d like to gain a deeper understanding of home cooking trends in various countries, please also check out the following article. From Stocking Up on Ingredients to Cleaning Up: Home Cooking in 8 Asian Countries ~Three Trends Revealed Through Food Culture~Food is an essential part of our lives. It strongly reflects a country’s culture, family structure, and infrastructure.・Grocery shopping and food storage habits・Changes in the kitchen’s main role・Time management for increasingly diverse meals
-
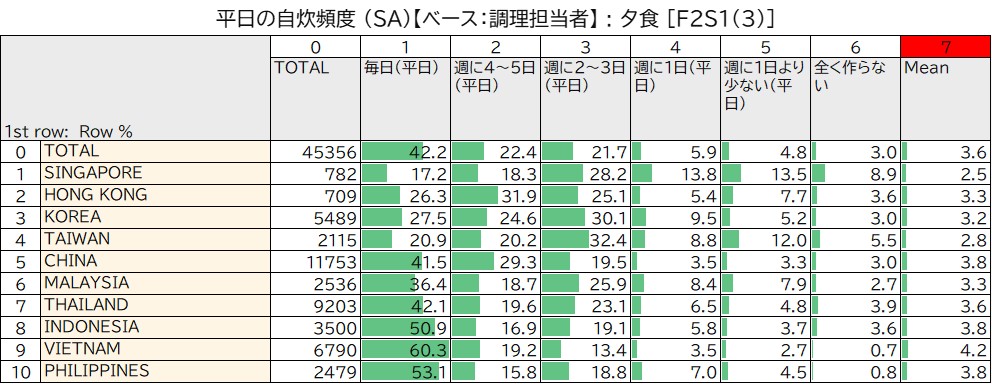
Frequency of Cooking at Home on Weekdays: Dinner (Intage Global Viewer)
- sellGlobal Viewer
calendar_monthApr 06, 2026
・Among those who responded that they cook their own dinner “every day” on weekdays, the country with the highest percentage was Vietnam (60.3%). This was followed by the Philippines (53.1%) and Indonesia (50.9%).・Among those who responded that they cook their own meals “2–3 days a week,” the country with the highest percentage was Taiwan (32.4%), followed by South Korea (30.1%).・Among those who answered “once a week (on weekdays),” the country with the highest percentage was Singapore (13.8%).Intage Global Viewer also provides the latest data for 2025/2026, as well as data on topics such as “frequency of home cooking on holidays.”Click here for more details.If you’d like to gain a deeper understanding of home cooking trends in various countries, please also check out the following article.From Stocking Up on Ingredients to Cleaning Up: Home Cooking in 8 Asian Countries ~Three Trends Revealed Through Food Culture~Food is an essential part of our lives. It strongly reflects a country’s culture, family structure, and infrastructure.・Grocery shopping and food storage habits・Changes in the kitchen’s main role・Time management for increasingly diverse dining experiences
-
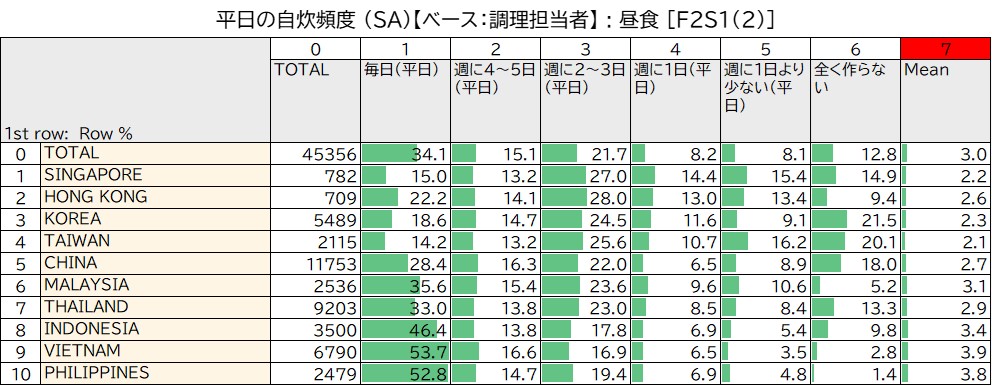
Frequency of Cooking at Home on Weekdays: Lunch (Intage Global Viewer)
- sellGlobal Viewer
calendar_monthApr 06, 2026
・Among those who reported cooking their own lunch “every day” on weekdays, the country with the highest percentage was Vietnam (53.7%), followed by the Philippines (52.8%) and Indonesia (46.4%).・Among those who responded that they cook for themselves “2–3 days a week,” the country with the highest percentage was Hong Kong (28.0%).・Among those who responded that they “never cook,” the country with the highest percentage was South Korea (21.5%), followed by Taiwan (20.1%).Intage Global Viewer also provides the latest data for 2025/2026, as well as data on topics such as “frequency of cooking on holidays.”Click here for more details.If you would like to gain a deeper understanding of home cooking habits in various countries, please also check out the following article. From Stocking Up on Ingredients to Cleaning Up: Home Cooking in 8 Asian Countries ~Three Trends Revealed Through Food Culture~Food is an essential part of our lives. It strongly reflects a country’s culture, family structure, and infrastructure.・Grocery shopping and food storage habits・Changes in the kitchen’s main role・Time management for increasingly diverse dining experiences
-
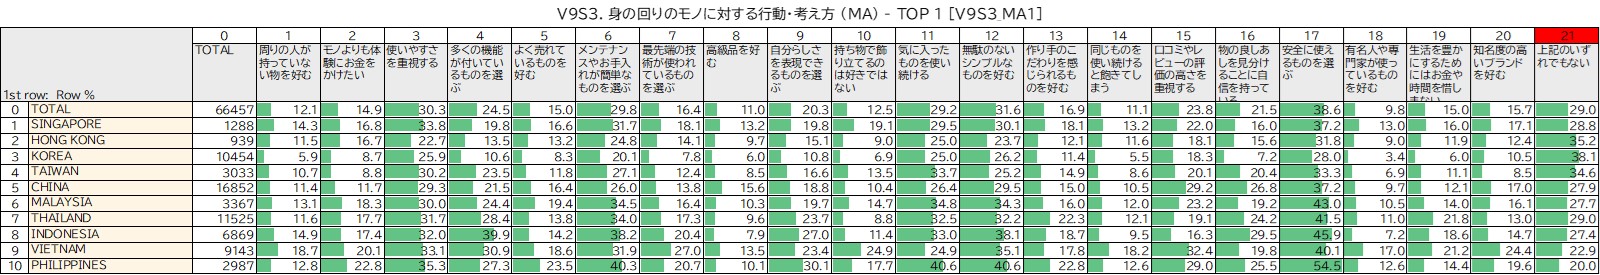
Attitudes and behaviors toward everyday objects (Intage Global Viewer)
- sellGlobal Viewer
calendar_monthApr 06, 2026
・Among those who answered that they “choose products that are safe to use,” the highest percentage was in the Philippines (54.5%), followed by Indonesia (45.9%).・Among those who answered that they “prefer simple, no-frills products,” the highest percentage was in the Philippines (40.6%), followed by Indonesia (38.1%).・Among those who answered “I choose products that use cutting-edge technology,” the country with the highest percentage was Vietnam (27.0%), followed by the Philippines (20.7%).Intage Global Viewer provides the latest data for 2025/2026, as well as data on “attitudes toward new technology” and other topics.Click here for more details.This article uses data from a large-scale survey covering 10 Asian countries, 280,000 respondents, and 404 items to reveal the true nature of Gen Z.Please take a look.Data Reveals Generation Z Across 10 Countries: What Are the Values of the Youth Shaping the World? ~ Unraveling Generation Z Lifestyles Through Country Comparisons ~This article explores their values and attitudes toward the world around them.・What kind of life do they want to lead?・Attitudes toward shopping・Expectations for their financial situation one year from now
-
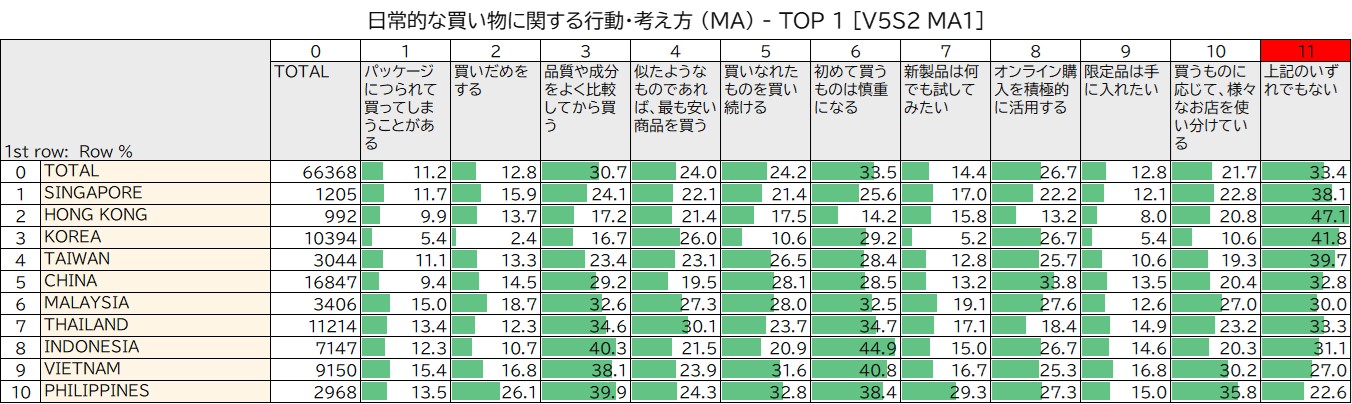
Attitudes and Behaviors Regarding Everyday Shopping (Intage Global Viewer)
- sellGlobal Viewer
calendar_monthApr 06, 2026
・Among those who responded that they “are cautious when buying something for the first time,” the highest percentage was in Indonesia (44.9%), followed by Vietnam (40.8%).・Among those who responded that they “want to try any new product,” the highest percentage was in the Philippines (29.3%), followed by Malaysia (19.1%).・The country with the highest percentage of respondents who said they “actively use online shopping” was China (33.8%), followed by Malaysia (27.6%).Intage Global Viewer also provides the latest data for 2025/2026, as well as data on topics such as “attitudes toward new technologies.”Click here for more details.This article uses data from a large-scale survey covering 10 Asian countries, 280,000 respondents, and 404 items to reveal the true nature of Gen Z.Please take a look. Data Reveals Generation Z Across 10 Countries: What Are the Values of the Youth Shaping the World? ~ Unraveling Generation Z Lifestyles Through Country Comparisons ~This article explores their values and attitudes toward the world around them.・What kind of life do they want to lead?・Attitudes toward shopping・Their financial situation one year from now
-
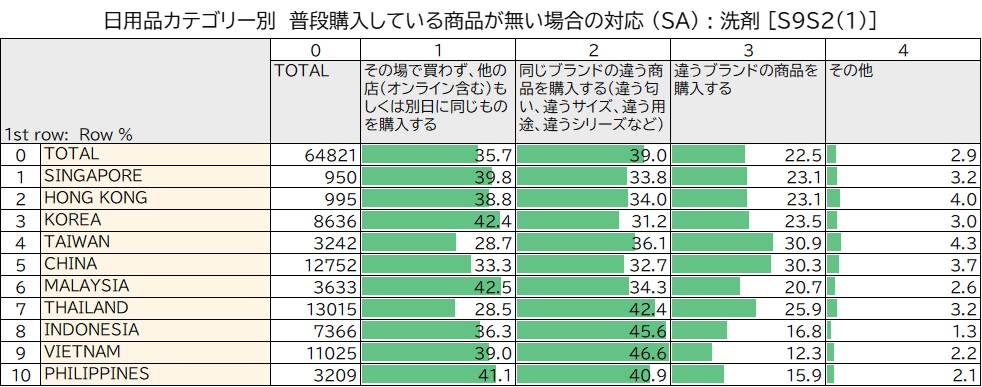
What to do if your usual household items (detergent) are out of stock (Intage Global Viewer)
- sellGlobal Viewer
calendar_monthApr 03, 2026
・Among those who answered “I would purchase a different product from the same brand (different scent, size, purpose, series, etc.),” the country with the highest percentage was Vietnam (46.6%), followed by Indonesia (45.6%) and Thailand (42.4%).・Among those who answered “I do not buy it on the spot, but purchase the same item at another store (including online) or on a different day,” the country with the highest percentage was Malaysia (42.5%), followed by South Korea (42.4%) and the Philippines (41.1%).・Among those who answered “I purchase a product from a different brand,” the country with the highest percentage was Taiwan (30.9%), followed by China (30.3%).Intage Global Viewer also provides the latest data for 2025/2026, as well as data on categories such as “cleaning tools and air fresheners.”Click here for more details.Please also check out the following article on laundry habits. 【Japan・Korea】What is a Convenient “Semi-Outdoor Balcony”? Differences in Laundry Habits Between Japan and KoreaThis article highlights differences between Japan and South Korea regarding where washing machines are placed, how laundry is dried, and where detergent is stored.・Where washing machines are placed・How laundry is dried・Where detergent is stored
-
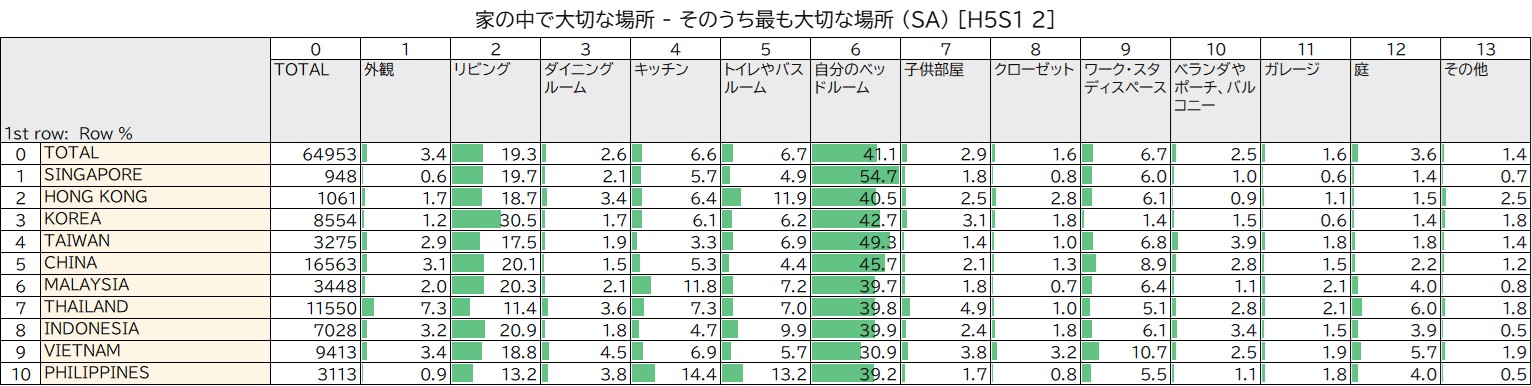
The Most Important Place in the House (Intage Global Viewer)
- sellGlobal Viewer
calendar_monthApr 03, 2026
・All countries responded that “their own bedroom” is the most important place. The highest percentage was in Singapore (54.7%), followed by Taiwan (49.3%) and China (45.7%).・Among those who answered “living room,” the highest percentage was in South Korea (30.5%), followed by Indonesia (20.9%).・Among those who chose “kitchen,” the highest percentage was in the Philippines (14.4%), followed by Malaysia (11.8%).Intage Global Viewer provides the latest data for 2025/2026, as well as data on “second and subsequent most important places” and more.Click here for more details.This article uses data from a large-scale survey covering 10 Asian countries, 280,000 respondents, and 404 items to reveal the true nature of Gen Z.Please take a look.Data Reveals Generation Z Across 10 Countries: What Are the Values of the Youth Shaping the World? ~ Unraveling Generation Z Lifestyles Through Country Comparisons ~This article introduces values by country and attitudes toward those around them.・What kind of life do they want to lead?・Attitudes toward shopping・Expectations for their financial situation one year from now
-
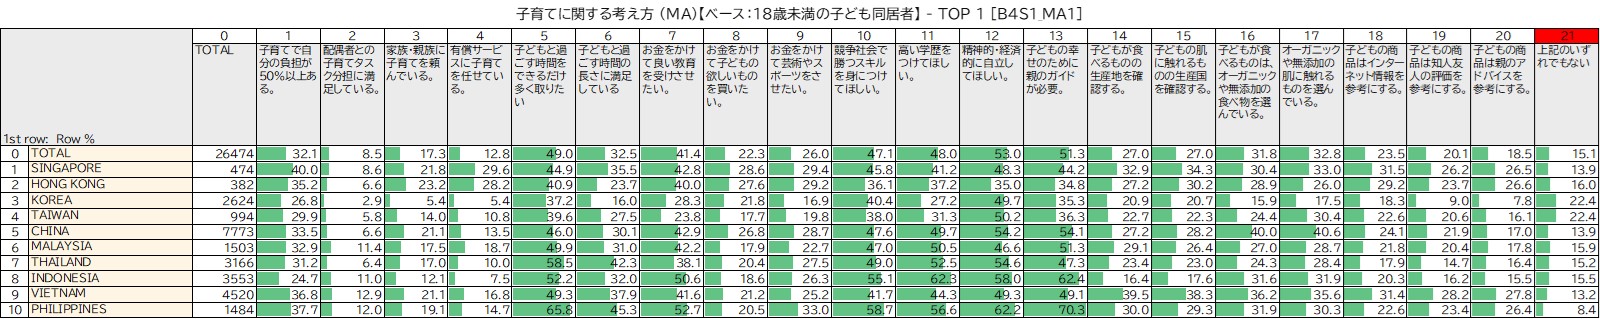
Attitudes Toward Child-Rearing (Intage Global Viewer)
- sellGlobal Viewer
calendar_monthApr 03, 2026
・Among those who responded that “parental guidance is necessary for a child’s happiness,” the highest percentage was in the Philippines (70.3%), followed by Indonesia (62.4%) and China (54.1%).・The country with the highest percentage of respondents who said, “I want to spend as much time as possible with my children,” was the Philippines (65.8%), followed by Thailand (58.5%) and Indonesia (52.2%).・The country with the highest percentage of respondents who said, “I choose organic or additive-free foods for my children,” was China (40.0%), followed by Vietnam (36.2%).Intage Global Viewer provides the latest data for 2025/2026, as well as data on “childcare items actually in use” and other topics.Click here for more details. This article uses data from a large-scale survey spanning 10 Asian countries, involving 280,000 participants and covering 404 items, to reveal the true nature of Generation Z.Please take a look. Data Reveals Generation Z Across 10 Countries: What Are the Values of the Youth Shaping the World? ~ Unraveling Generation Z Lifestyles Through Country Comparisons ~ It introduces the values and attitudes toward others in each country.・What kind of life do they want to lead?・Attitudes toward shopping・Their financial situation one year from now
-
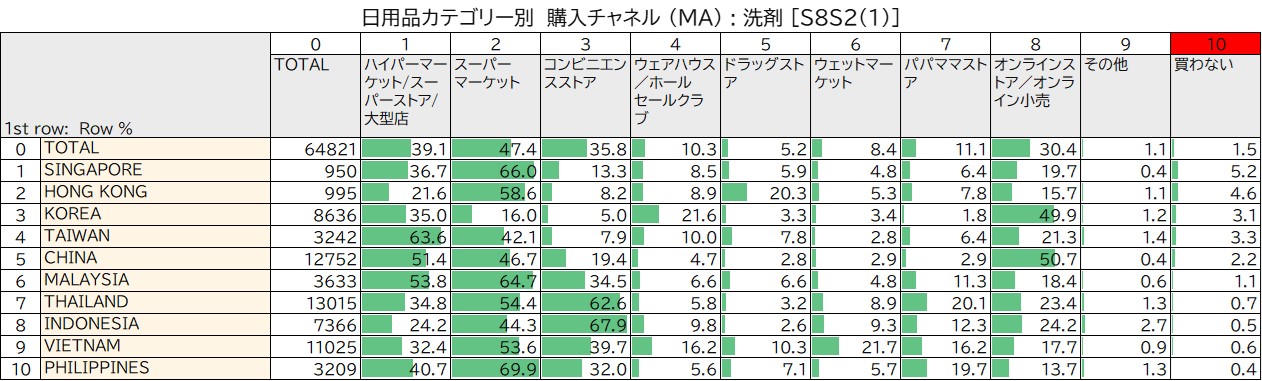
Purchase Channels for Household Goods (Detergents) (Intage Global Viewer)
- sellGlobal Viewer
calendar_monthApr 03, 2026
・The countries where the highest percentage of people shop at “supermarkets” are the Philippines (69.9%), followed by Singapore (66.0%) and Malaysia (64.7%).・The country where the highest percentage of purchases are made at “convenience stores” is Indonesia (67.9%), followed by Thailand (62.6%).・The country where the highest percentage of purchases are made at “online stores/online retailers” is China (50.7%), followed by South Korea (49.9%).Intage Global Viewer also provides the latest data for 2025/2026, as well as data on topics such as “Purchase Channels for Cleaning Supplies and Air Fresheners.”Click here for more details. Please also check out the following article on laundry habits.【Japan・Korea】What is a Convenient “Semi-Outdoor Balcony”? Differences in Laundry Habits Between Japan and KoreaThis article highlights differences between Japan and South Korea regarding where washing machines are placed, how laundry is dried, and where detergent is stored.・Where washing machines are placed・How laundry is dried・Where detergent is stored