Search Results
sellTag: Global Viewer - 22 results
-
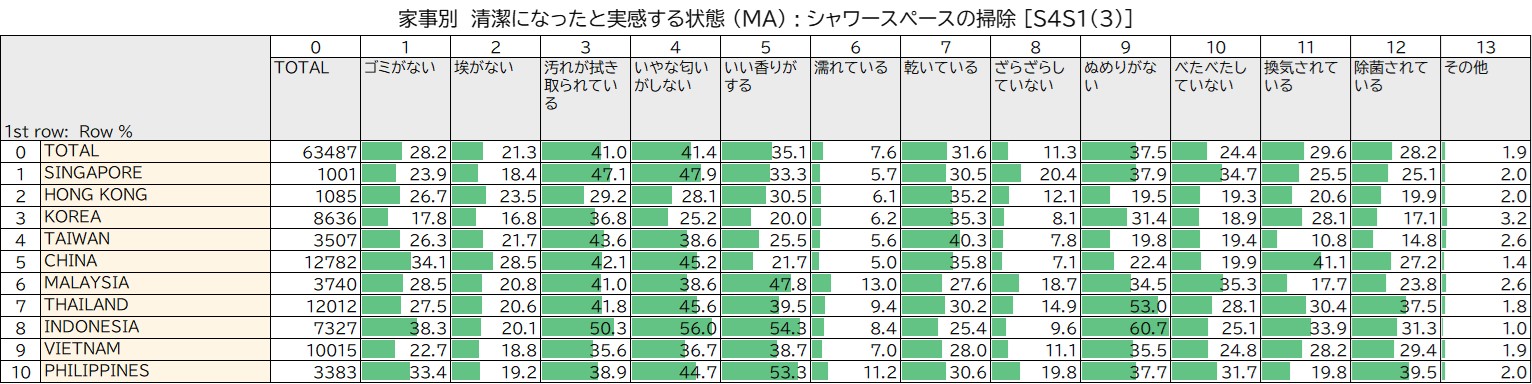
清潔になったと実感する状態・シャワースペース(Intage Global Viewer)
- sellGlobal Viewer
calendar_month2026/04/02
・「ぬめりがない」状態が最も高かったのは、インドネシア(60.7%)、次いでインドネシア(53.0%)。・「換気されている」状態が最も高かったのは、中国(41.1%)、次いでインドネシア(33.9%)。・「べたべたしていない」状態が最も高かったのは、マレーシア(35.3%)、次いでシンガポール(34.7%)。Intage Global Viewerでは2025/2026の最新データ、または「洗濯、食器洗い、その他スペースの状態」などのデータも扱っております。詳しくはこちらへ。清潔になったと実感する調査に関する記事として、以下も併せてご確認ください。 【アジア各国のZ世代】「いい香り」を大切にするフィリピンZ世代フィリピン人は自分たちのことを「綺麗好きな国民」と言うことが多い中、清潔に対する意識について紹介します。・フィリピンの住宅事情・メイドの掃除スタイル・香りへのこだわり
-
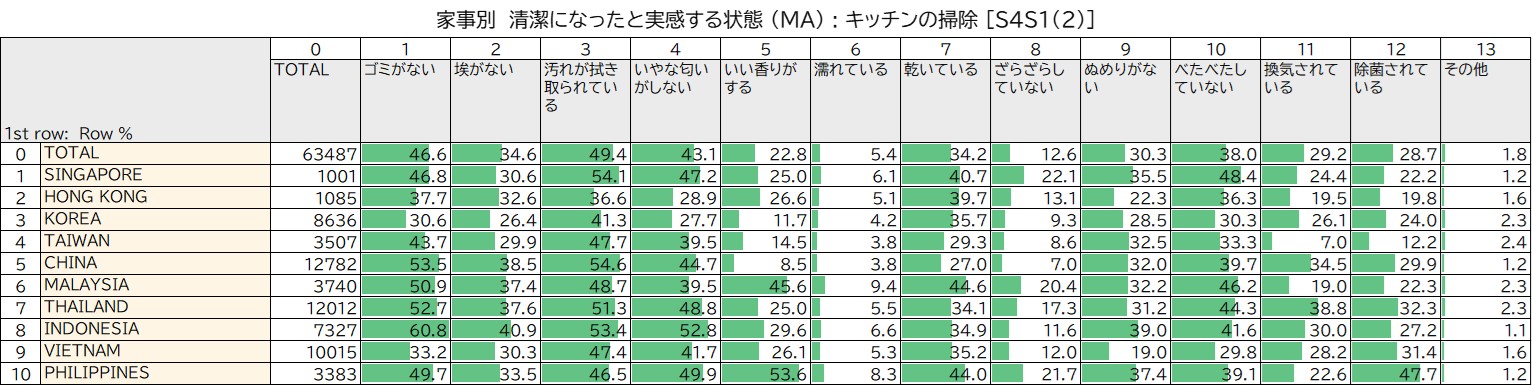
清潔になったと実感する状態・キッチン(Intage Global Viewer)
- sellGlobal Viewer
calendar_month2026/04/02
・「ゴミがない」状態が最も高かったのは、インドネシア(60.8%)。・「いい香りがする」状態が最も高かったのは、フィリピン(53.6%)、次いでマレーシア(45.6%)。・「除菌されている」状態が最も高かったのは、フィリピン(47.7%)、次いでタイ(32.3%)。Intage Global Viewerでは2025/2026の最新データ、または「洗濯、食器洗い、その他スペースの状態」などのデータも扱っております。詳しくはこちらへ。 清潔になったと実感する調査に関する記事として、以下も併せてご確認ください。 【アジア各国のZ世代】「いい香り」を大切にするフィリピンZ世代フィリピン人は自分たちのことを「綺麗好きな国民」と言うことが多い中、清潔に対する意識について紹介します。・フィリピンの住宅事情・メイドの掃除スタイル・香りへのこだわり
-
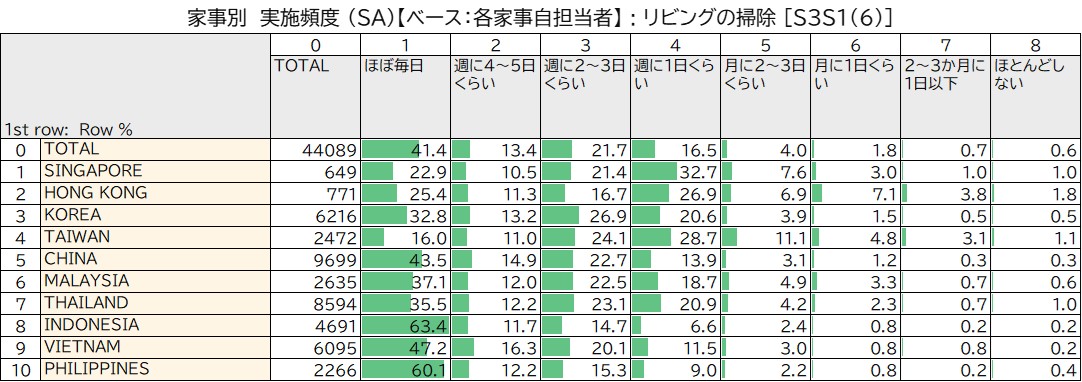
掃除の頻度・リビング(Intage Global Viewer)
- sellGlobal Viewer
calendar_month2026/04/02
・「ほぼ毎日」「週に2~3日くらい」「週に1日くらい」の頻度でリビングを掃除している傾向がある。・「ほぼ毎日」が最も高かったのは、インドネシア(63.4%)、次いでフィリピン(60.1%)。・「週に1日くらい」が最も高かったのは、シンガポール(32.7%)、次いで台湾(28.7%)、香港(26.9%)。Intage Global Viewerでは2025/2026の最新データ、または「洗濯、食器洗い、その他スペースの掃除頻度」などのデータも扱っております。詳しくはこちらへ。住環境と掃除事情に関する記事として、以下も併せてご確認ください。【中国:地球の暮らし方】中国住宅の住環境と掃除事情中国と日本の掃除道具と掃除の仕方の違いについて紹介します。・空間ごとに違う床材・掃除の順番と使用する道具
-
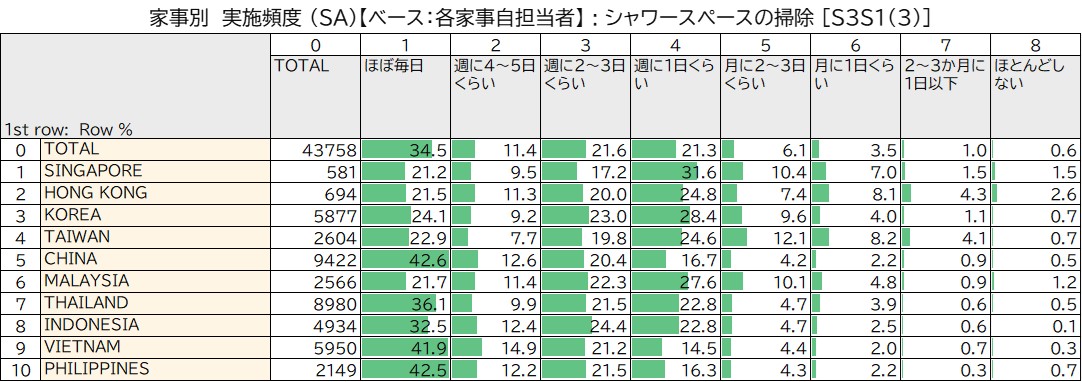
掃除の頻度・シャワースペース(Intage Global Viewer)
- sellGlobal Viewer
calendar_month2026/04/02
・「ほぼ毎日」「週に2~3日くらい」「週に1日くらい」の頻度でシャワースペースを掃除している傾向がある。・「ほぼ毎日」が最も高かったのは、中国(42.6%)、次いでフィリピン(42.5%)、ベトナム(41.9%)。・「週に1日くらい」が最も高かったのは、シンガポール(31.6%)、次いで韓国(28.4%)、マレーシア(27.6%)。 Intage Global Viewerでは2025/2026の最新データ、または「洗濯、食器洗い、その他スペースの掃除頻度」などのデータも扱っております。詳しくはこちらへ。住環境と掃除事情に関する記事として、以下も併せてご確認ください。【中国:地球の暮らし方】中国住宅の住環境と掃除事情中国と日本の掃除道具と掃除の仕方の違いについて紹介します。・空間ごとに違う床材・掃除の順番と使用する道具
-
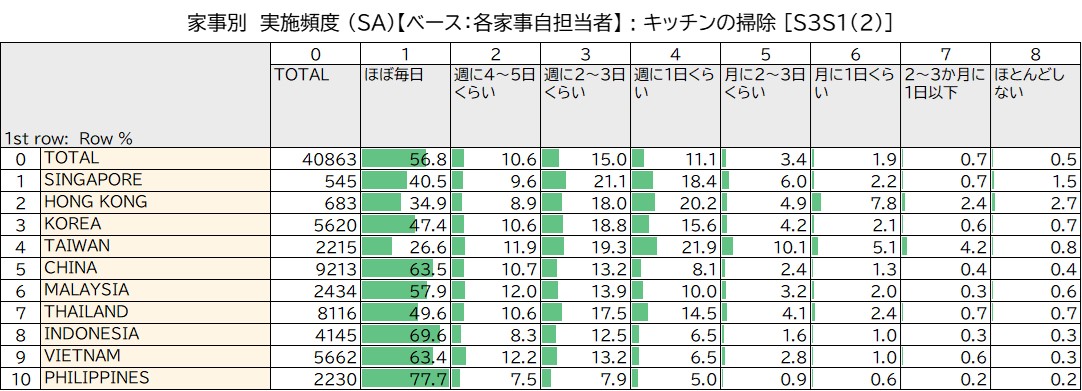
掃除の頻度・キッチン(Intage Global Viewer)
- sellGlobal Viewer
calendar_month2026/04/02
・全ての国で、「ほぼ毎日」キッチンの掃除を実施するが一番高かった。最も高かったのはフィリピン(77.7%)、次いでインドネシア(69.6%)。・台湾の中では「ほぼ毎日」が一番高かったが、26.6%で他の国と比較すると低い。一方で、「週に1日くらい」の回答が21.9%と他の国より高かった。Intage Global Viewerでは2025/2026の最新データ、または「洗濯、食器洗い、その他スペースの掃除頻度」などのデータも扱っております。詳しくはこちらへ。住環境と掃除事情に関する記事として、以下も併せてご確認ください。【中国:地球の暮らし方】中国住宅の住環境と掃除事情中国と日本の掃除道具と掃除の仕方の違いについて紹介します。・空間ごとに違う床材・掃除の順番と使用する道具
-
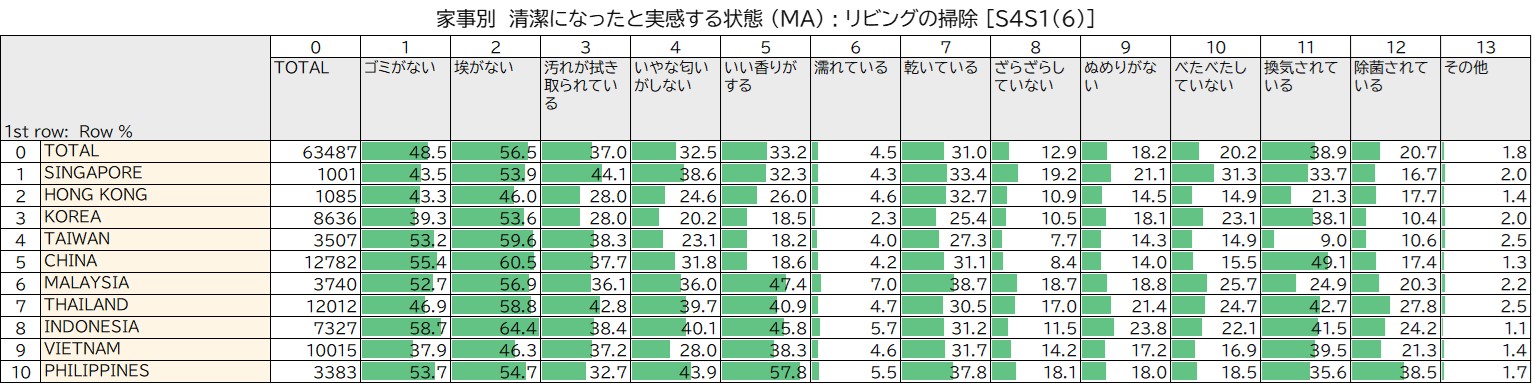
清潔になったと実感する状態・リビング(Intage Global Viewer)
- sellGlobal Viewer
calendar_month2026/04/01
・全ての国で、清潔になった実感するのは「埃がない」状態が総じて高かった。・フィリピンは「いい香りがする」ことが一番高かった(57.8%)。・中国は他国よりも「換気されている」ことが高かった(49.1%)。Intage Global Viewerでは2025/2026の最新データ、または「洗濯、食器洗い、その他スペースの状態」などのデータも扱っております。詳しくはこちらへ。清潔になったと実感する調査に関する記事として、以下も併せてご確認ください。【アジア各国のZ世代】「いい香り」を大切にするフィリピンZ世代フィリピン人は自分たちのことを「綺麗好きな国民」と言うことが多い傾向があります。この記事では、清潔に対する意識について紹介します。・フィリピンの住宅事情・メイドの掃除スタイル・香りへのこだわり
-
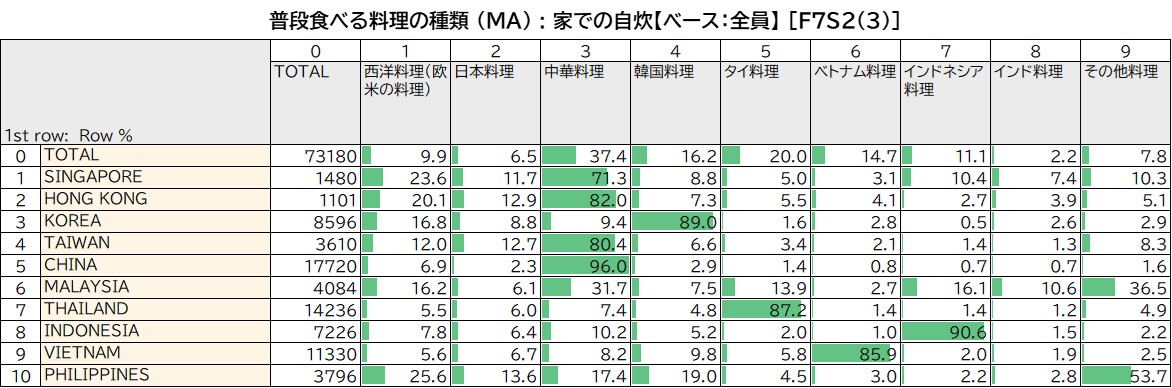
家での自炊で普段食べる料理の種類(Intage Global Viewer)
- sellGlobal Viewer
calendar_month2026/04/01
・家で自炊して食べる料理の種類について、10カ国中5カ国で自国の料理を最も食べると回答。高かった順に、中国:中華料理(96.0%)、インドネシア:インドネシア料理(90.6%)、韓国:韓国料理(89.0%)。・西洋料理(欧米の料理)を食べると回答した国で一番高かったのはフィリピン(25.6%)。Intage Global Viewerでは2025/2026の最新データ、または「自宅で和食を作る割合」などのデータも扱っております。詳しくはこちらへ。各国の家庭料理事情について、もっと詳しく理解したい場合は、以下の記事も併せてご確認ください。食材の買い足しから片付けまで:アジア8カ国の家庭料理事情私たちの生活に欠かせない「食」。食には、その国の文化・家族構成・インフラ事情が色濃く反映されます。・食材の買い出し、保存習慣・台所の主役の変化・多様化する食卓のタイムマネジメント
-
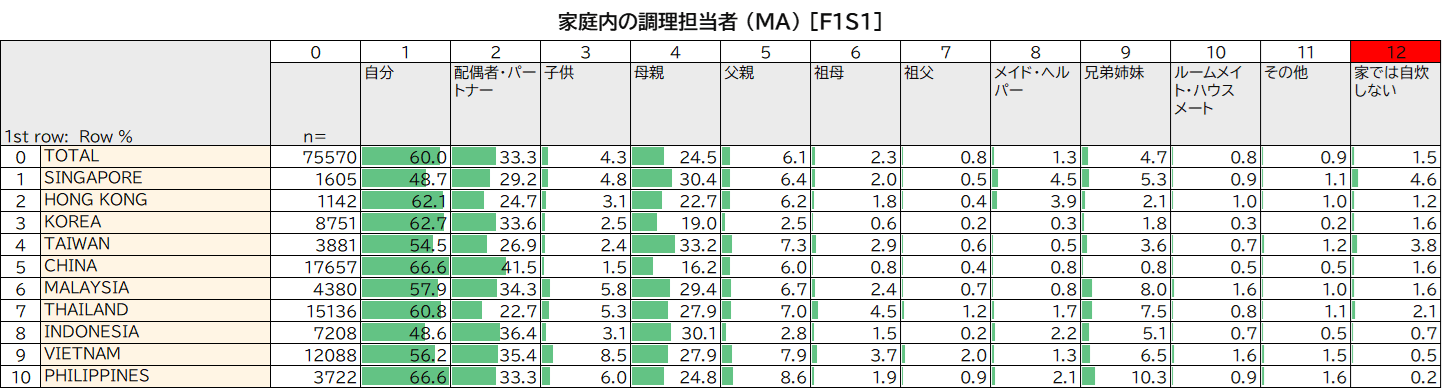
家庭内の調理担当者(Intage Global Viewer)
- sellGlobal Viewer
calendar_month2026/03/31
・全ての国において自分で料理を作ることが一番多かった。・10カ国中母親が料理を作ることが一番多かったのは台湾(33.2%)。・10カ国中配偶者・パートナーが料理を作ることが一番多かったのは中国(41.5%)。Intage Global Viewerでは2025/2026の最新データ、または「食材の購入担当」などのデータも扱っております。詳しくはこちらへ。各国の家庭料理事情についてもっと詳しく理解したい場合以下の記事も併せてご確認ください。食材の買い足しから片付けまで:アジア8カ国の家庭料理事情私たちの生活に欠かせない「食」。食には、その国の文化・家族構成・インフラ事情が色濃く反映されます。・食材の買い出し、保存習慣・台所の主役の変化・多様化する食卓のタイムマネジメントhttps://www.global-market-surfer.com/pickup/detail/649/
-
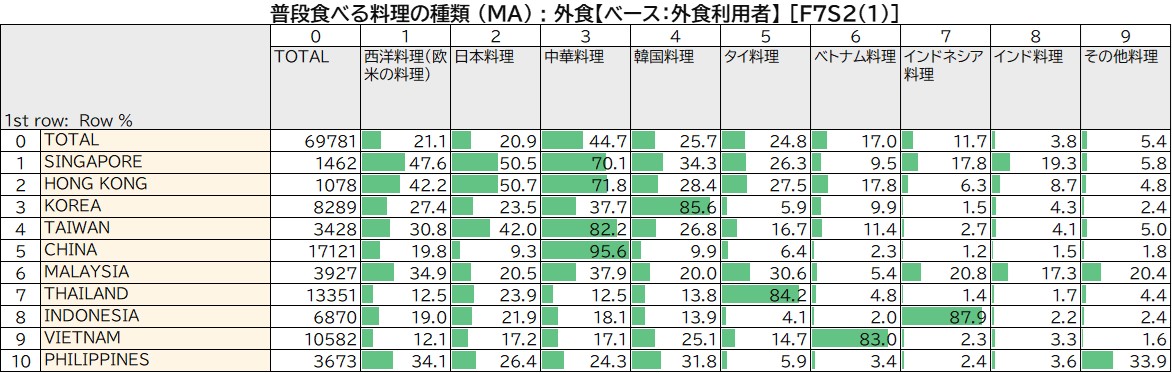
外食で普段食べる料理の種類(Intage Global Viewer)
- sellGlobal Viewer
calendar_month2026/03/31
・外食で食べる料理の種類について、10カ国中5カ国で自国の料理を最も食べると回答。高かった順に、中国:中華料理(95.6%)、インドネシア:インドネシア料理(87.9%)、韓国:韓国料理(85.6%)、タイ:タイ料理(84.2%)、ベトナム:ベトナム料理(83.0%)。・日本料理を食べると回答した国で、一番多かったのは香港(50.7%)、次いでシンガポール(50.5%)、台湾(42.0%)。 Intage Global Viewerでは2025/2026の最新データ、または「自宅で和食を作る割合」などのデータも扱っております。詳しくはこちらへ。各国の家庭料理事情について、もっと詳しく理解したい場合は、以下の記事も併せてご確認ください。 食材の買い足しから片付けまで:アジア8カ国の家庭料理事情私たちの生活に欠かせない「食」。食には、その国の文化・家族構成・インフラ事情が色濃く反映されます。・食材の買い出し、保存習慣・台所の主役の変化・多様化する食卓のタイムマネジメント
-
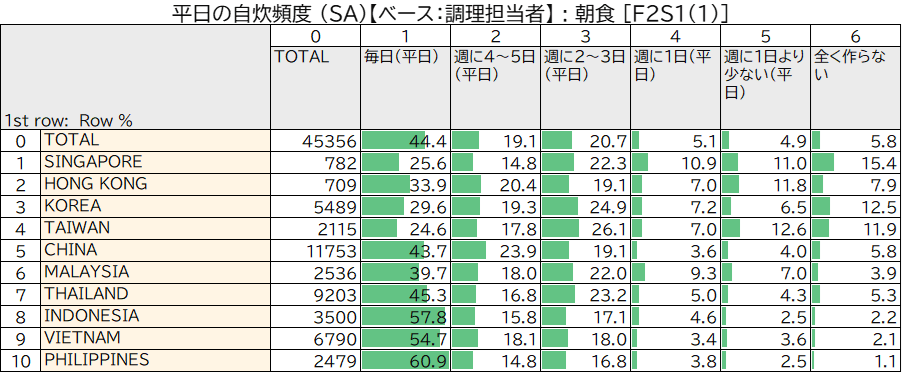
平日の自炊頻度_朝食(Intage Global Viewer)
- sellGlobal Viewer
calendar_month2026/03/31
・平日の朝食を毎日自炊すると回答した中で一番多かった国は、フィリピン(60.9%)。次いでインドネシア(57.8%)、ベトナム(54.7%)。・週に4~5日、自炊すると回答した中で一番多かった国は、中国(23.9%)。・シンガポールは、全く作らないと回答した中で一番多かった(15.4%)。Intage Global Viewerでは2025/2026の最新データ、または「休日の自炊頻度」などのデータも扱っております。詳しくはこちらへ。各国の家庭料理事情について、もっと詳しく理解したい場合は、以下の記事も併せてご確認ください。食材の買い足しから片付けまで:アジア8カ国の家庭料理事情私たちの生活に欠かせない「食」。食には、その国の文化・家族構成・インフラ事情が色濃く反映されます。・食材の買い出し、保存習慣・台所の主役の変化・多様化する食卓のタイムマネジメント