解説
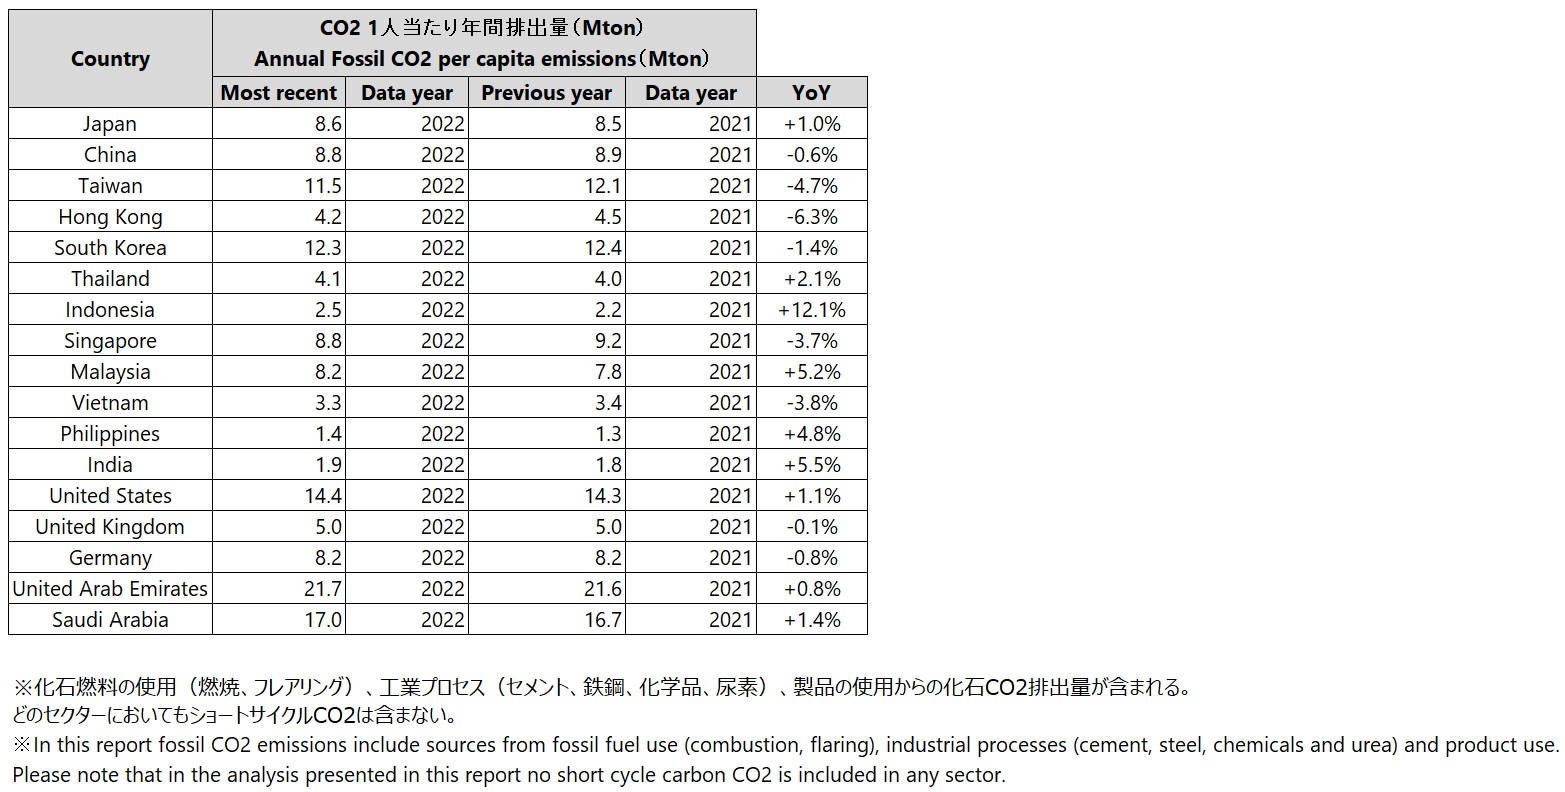
1人当たりCO2排出量は、中東のアラブ首長国連邦とサウジアラビアがそれぞれTop1とTop2。次いで、アメリカ、韓国、台湾が続く。
直近2年を見ると、インドネシアが12.1%増で伸び率が最も高い。
---
海外生活者データで、意思決定をスマートに加速
Global Viewer
インテージがストックする11カ国(アジア・US)の生活者の様々な実態・意識に関するアンケートデータを用いて、ご課題に応じたレポートをご提供するサービス。
カバーしている項目は、各種商品・サービスカテゴリーに関する行動実態・意識、価値観・情報接触など400項目に及ぶ。
▼詳細はこちら
引用
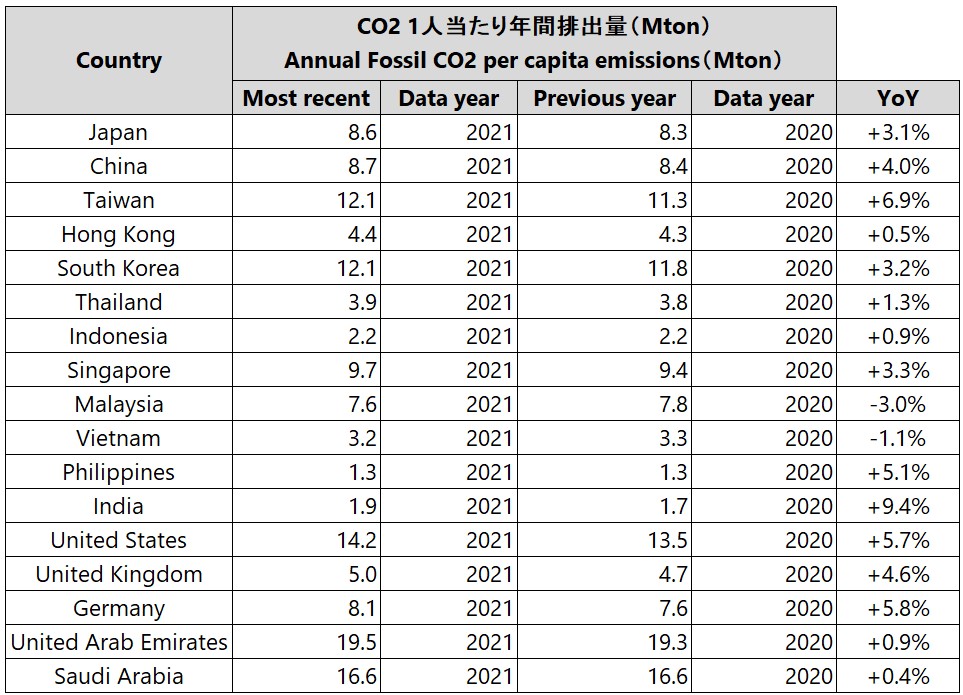
解説
1人当たりCO2排出量は、中東のアラブ首長国連邦とサウジアラビアがそれぞれTop1とTop2。次いで、アメリカ、韓国、台湾が続く。
直近2年を見ると、インドが9.4%増で伸び率が最も高い。
引用
※化石燃料の使用(燃焼、フレアリング)、工業プロセス(セメント、鉄鋼、化学品、尿素)、製品の使用からの化石CO2排出量が含まれる。
どのセクターにおいてもショートサイクルCO2は含まない。
※In this report fossil CO2 emissions include sources from fossil fuel use (combustion, flaring), industrial processes (cement, steel, chemicals and urea) and product use.
Please note that in the analysis presented in this report no short cycle carbon CO2 is included in any sector.
European Commission ”Fossil CO2 and GHG emissions of all world countries, 2022 report”
Retrieved Nov 02, 2022, from http://bit.ly/3pjfHCj
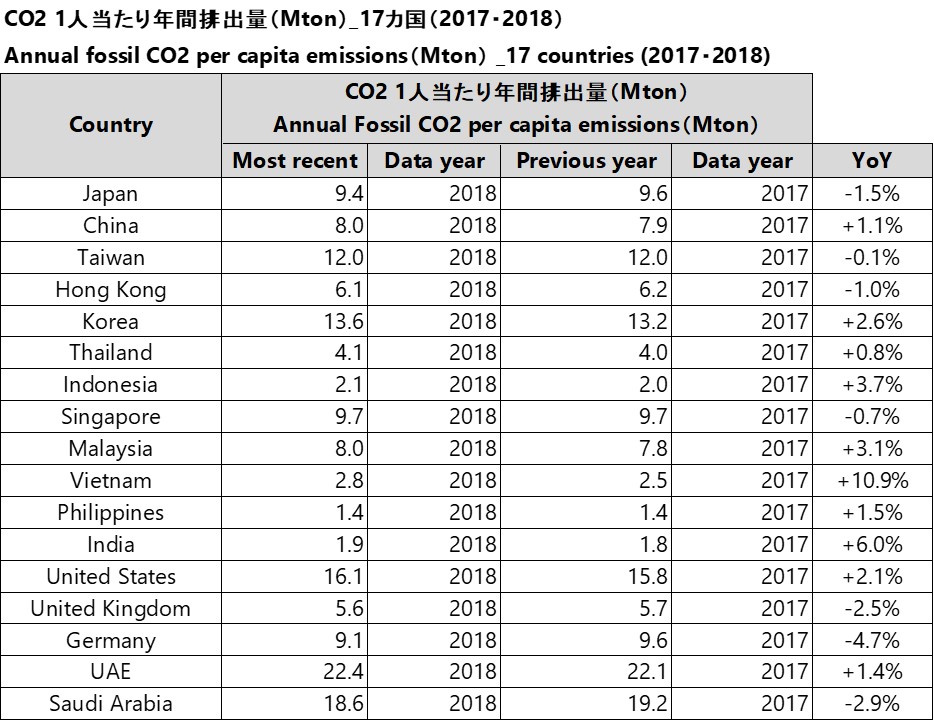
解説
1人当たりCO2排出量は、中東のアラブ首長国連邦とサウジアラビアがそれぞれTop1とTop2。次いで、アメリカ、韓国、台湾が続く。 直近2年を見ると、ベトナムが10.9%増で伸び率が最も高く、アジア諸国を中心に増加傾向。
引用
Reference European Commission ”Fossil CO2 and GHG emissions of all world countries, 2019 report” Retrieved December 23, 2020, from http://bit.ly/3pjfHCj ※化石燃料の使用(燃焼、フレアリング)、工業プロセス(セメント、鉄鋼、化学品、尿素)、製品の使用からの化石CO2排出量が含まれる。 どのセクターにおいてもショートサイクルCO2は含まない。 ※In this report fossil CO2 emissions include sources from fossil fuel use (combustion, flaring), industrial processes (cement, steel, chemicals and urea) and product use. Please note that in the analysis presented in this report no short cycle carbon CO2 is included in any sector.