Commentary
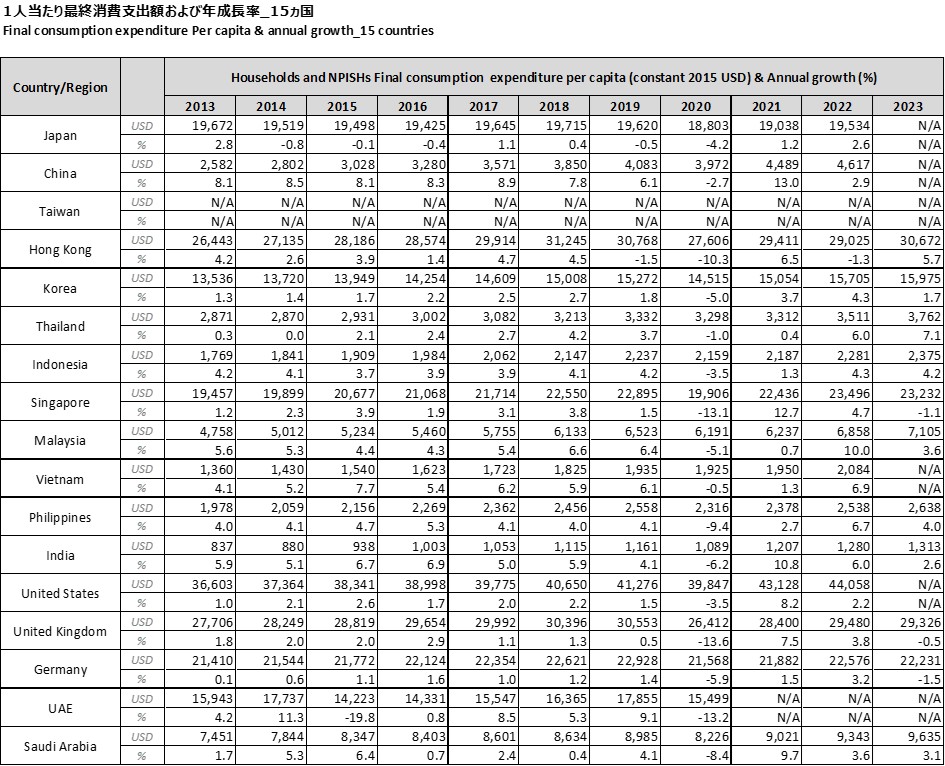
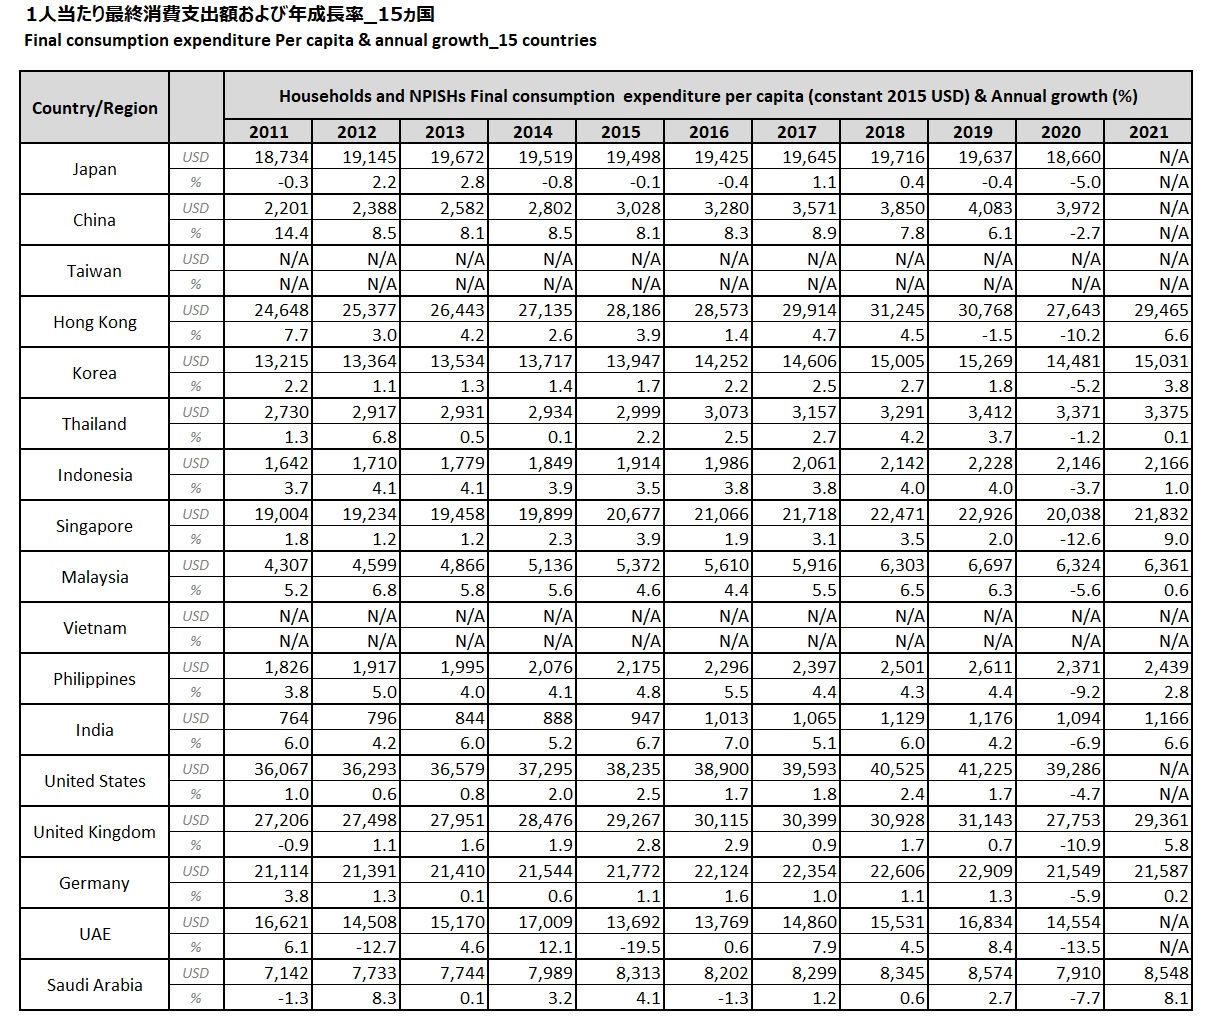
Among the 15 countries, the United States (39,286 USD), the United Kingdom (27,753 USD), and Hong Kong (27,643 USD) had the largest final consumption expenditure per capita in 2020. Final consumption expenditure per capita in 2020 was negative in all countries due to the outbreak of Covid-19 infection. In particular, declines of the UAE (-13.5%), Singapore (-12.6%), and Hong Kong (-10.2%) were conspicuous. In 2021, the amount of Final consumption expenditure in each country is recovering as the epidemic of Covid-19 infection has settled down, especially Saudi Arabia showed an increase of +8.1%, covering the negative growth of the previous year (-7.7%).
Reference
Reference The World Bank (1) Households and NPISHs Final consmption expenditure per capita (constant 2015 USD) Retrieved Oct 8, 2022, from https://data.worldbank.org/indicator/NE.CON.PRVT.PC.KD (2) Households and NPISHs Final consmption expenditure per capita growth (annual %) Retrieved Oct 8, 2022, from https://data.worldbank.org/indicator/NE.CON.PRVT.PC.KD.ZG