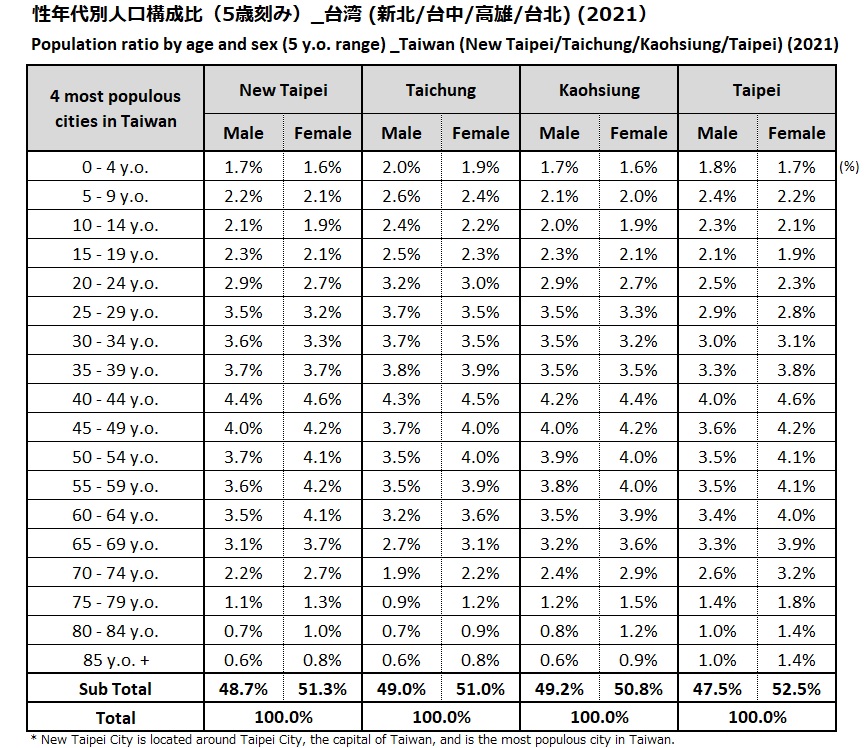
Population ratio by age and sex (5 y.o. range) _Taiwan (New Taipei/Taichung/Kaohsiung/Taipei) (2021)
* Chities are listed in descending order according to population from left to right.
* All percentages may not total 100% due to rounding
Population ratio by age and sex (5 y.o. range) _Taiwan (New Taipei/Taichung/Kaohsiung/Taipei) (2021)
Reference
Dept. of Household Registration, Ministry of the Interior. Republic of China, Demographics, 04. Province and city population by age_end of November 2022
中華民国內政部戶政司全球資訊網, 人口統計資料, 04. 縣市人口按單齡(2022年11月底)
Retrieved Dec 28, 2022, from here
- Population
- 858 Views