DataData Population

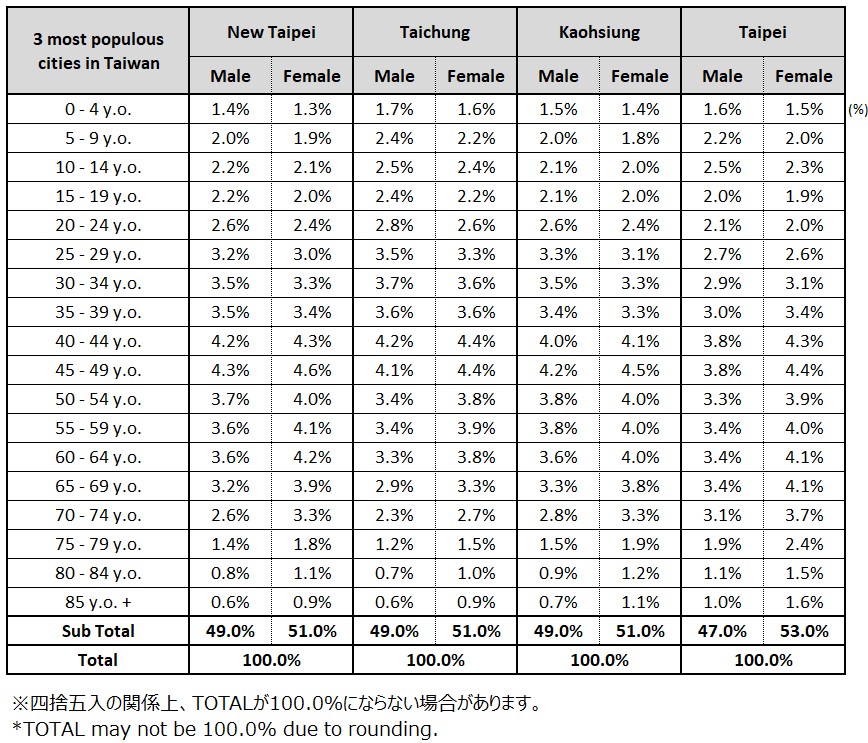
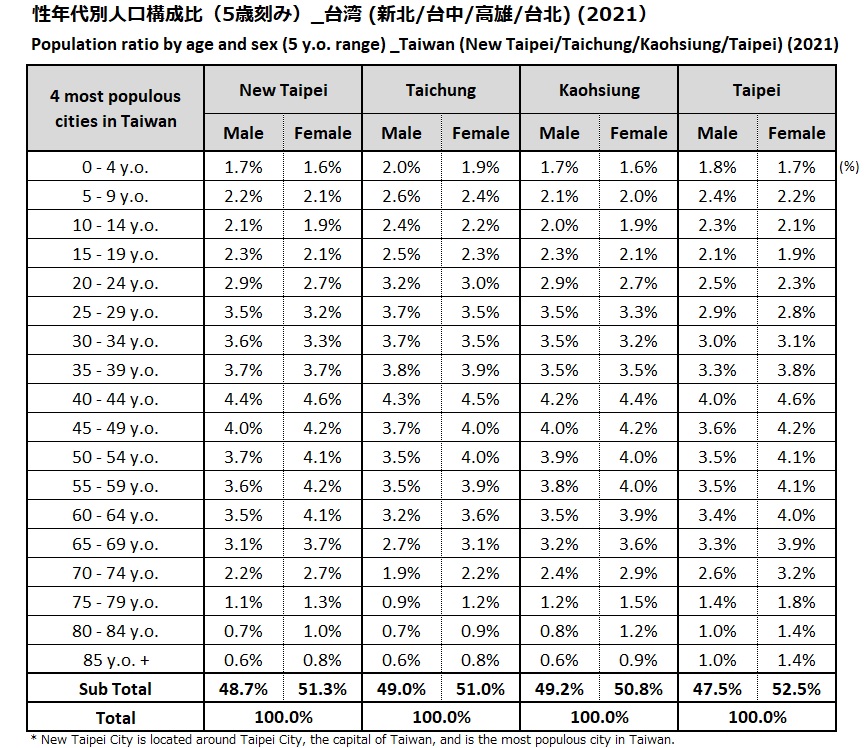
Population ratio by age and sex (5 y.o. range) _Taiwan (New Taipei/Taichung/Kaohsiung/Taipei)

  • 2025
  • 2021

* Chities are listed in descending order according to population from left to right.

images

Reference
Dept. of Household Registration, Ministry of the Interior. Republic of China, Demographics, 04. Province and city population by age_end of July 2025
中華民国內政部戶政司全球資訊網, 人口統計資料, 04. 縣市人口按單齡(2025年7月底)
Retrieved Aug 20, 2025, from here

Download

* Chities are listed in descending order according to population from left to right.


* All percentages may not total 100% due to rounding

images

Reference
Dept. of Household Registration, Ministry of the Interior. Republic of China, Demographics, 04. Province and city population by age_end of November 2022
中華民国內政部戶政司全球資訊網, 人口統計資料, 04. 縣市人口按單齡(2022年11月底)
Retrieved Dec 28, 2022, from here

Download


Reproducing and quotation
  • The copyright of this report/column is held by Intage Inc. or the company to which the author belongs. Please confirm the following prohibitions and cautions, and specify the source when reproducing or quoting.
    Example:
    "Source: Intage's Research Report "(Report title) (issued on DD/MM/YYYY)"
    "Source: Global Market Surfer, article published on DD/MM/YYYY"
  • Prohibiton:
    • Modification of part or all of the contents
    • Sale or publication of part or all of the contents
    • Use that is offensive to public order and morals or that leads to illegal activities
    • Reprpducing or quotation for the purpose of advertising or sales promotion of companies, products, or services.
  • Other cautions:
    • We are not responsible for any trouble, loss or damage caused by the use of this report.
    • These terms of use do not restrict the use of quotations, etc., which are permitted under the Copyright Act.
  • If you have any questions about reprinting or quotation, please contact us from here

Newest data