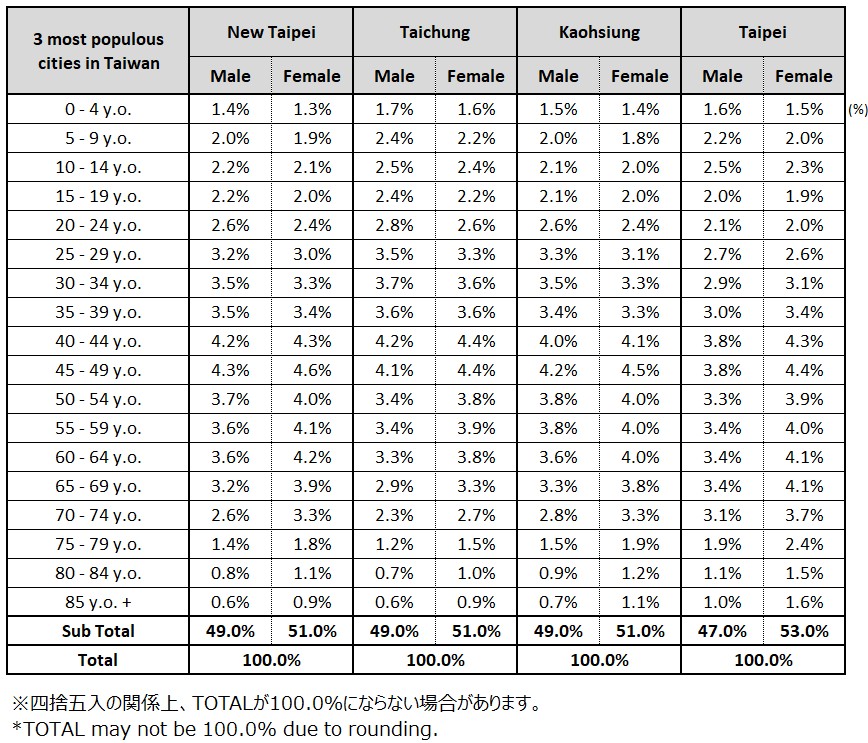
Commentary
* Chities are listed in descending order according to population from left to right.
---
Taiwan is known for its pro-Japanese sentiment and is attracting significant attention as a destination for Japanese companies looking to expand. But how well do you understand the “average” lifestyle and values of Taiwanese people?
Drawing on various data sources, including Intage’s “Global Viewer” survey of overseas consumers, we’ll break down and explain the “average” that defines Taiwanese consumers, as well as the latest trends emerging from this data.
Let’s Get to Know the “Average” Taiwanese Person! A Comprehensive Guide to the Typical Consumer Profile and the Latest Trends
・Lifestyle: Housing, Environment, Housework, and Marriage
・Food Culture, Health, and Sports Awareness
Reference
Reference
Dept. of Household Registration, Ministry of the Interior. Republic of China, Demographics, 04. Province and city population by age_end of July 2025
中華民国內政部戶政司全球資訊網, 人口統計資料, 04. 縣市人口按單齡(2025年7月底)
Retrieved Aug 20, 2025, from here
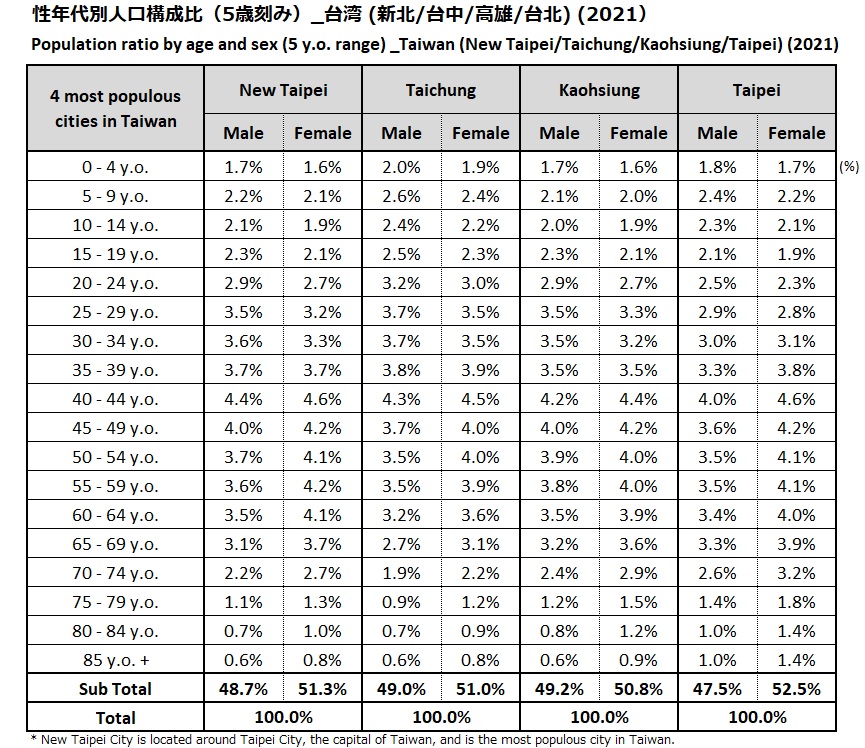
Commentary
* Chities are listed in descending order according to population from left to right.
* All percentages may not total 100% due to rounding
Reference
Reference
Dept. of Household Registration, Ministry of the Interior. Republic of China, Demographics, 04. Province and city population by age_end of November 2022
中華民国內政部戶政司全球資訊網, 人口統計資料, 04. 縣市人口按單齡(2022年11月底)
Retrieved Dec 28, 2022, from here