Last updatedcalendar_monthDec 30, 2022Population ratio by age and sex (5 y.o. range) _Thailand (Bangkok/Mueang Samut Prakan/Mueang Nakhon Ratchasima) (2010)
Statistics
Commentary
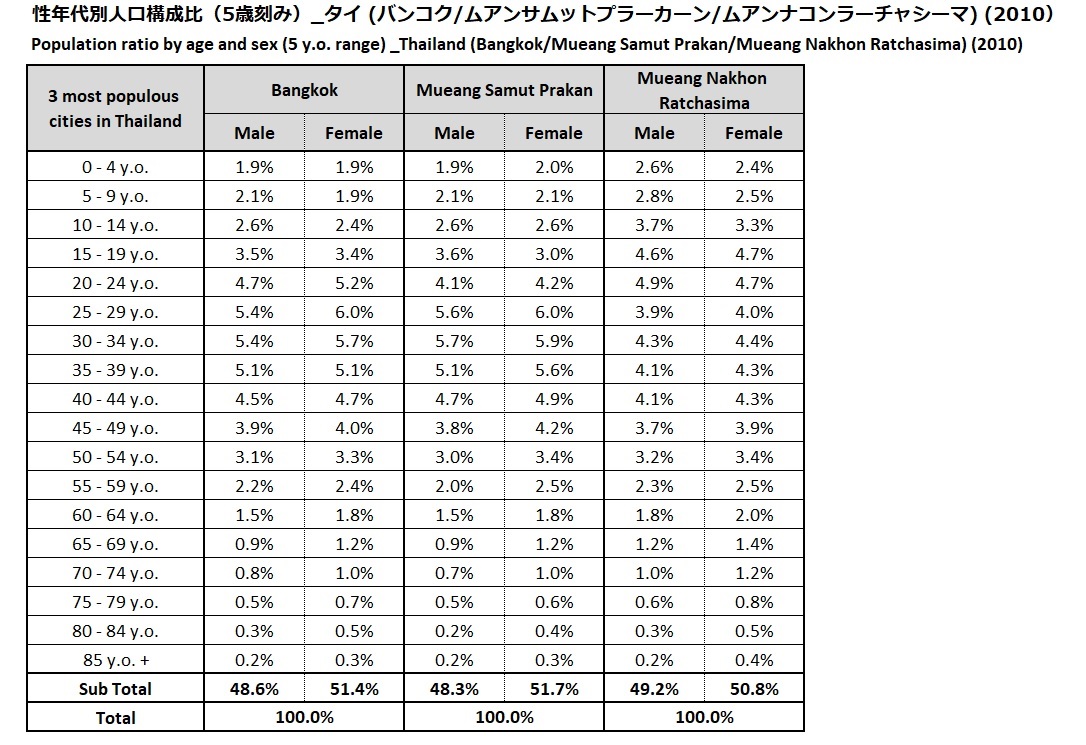
* 3 Cities are listed in descending order according to population from left to right.
* All percentages may not total 100% due to rounding.
Reference
Reference
National Statistics Office of Thailand, "The 2010 Population and Housing census"
Retrieved Dec 29, 2022, from here
About Reproduction and Quotation
Sign up for free
downloadDownload data