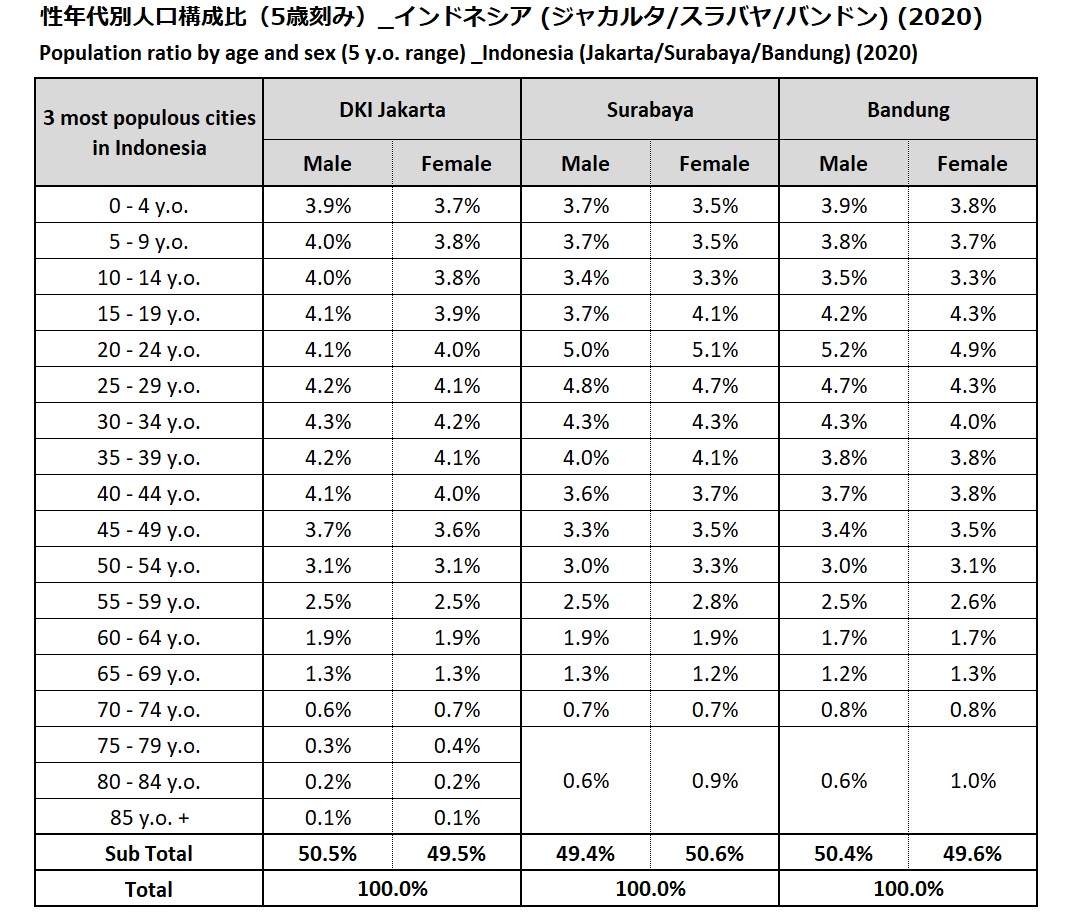
Population ratio by age and sex (5 y.o. range) _Indonesia (Jakarta/Surabaya/Bandung) (2020)
* 3 Cities are listed in descending order according to population from left to right.
* All percentages may not total 100% due to rounding.
Population ratio by age and sex (5 y.o. range) _Indonesia (Jakarta/Surabaya/Bandung) (2020)
Reference
Jakarta: Statistics Indonesia, "Statistical Yearbook of Indonesia 2021", Number of Population Results SP2020 male Female by Region, Age Group, 2020
Retrieved Dec. 30, 2022, from here
Surabaya: Statistics of Surabaya City, Statistics Table - Population, Projection of Surabaya Municipality Population, 2018 - 2020
Retrieved Dec. 30, 2022, from here
Bandung: Statistics of Bandung City, Statistics Table - Population by Age Group and Sex, 2018 - 2020
Retrieved Dec. 30, 2022, from here
- Population
- 2081 Views