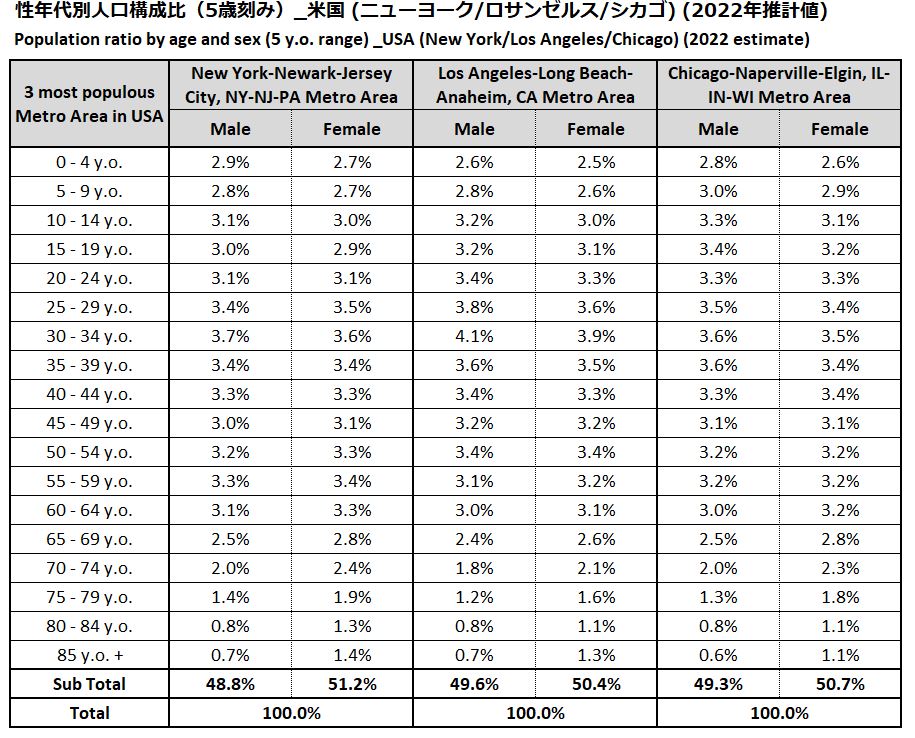
Commentary
*The population composition is calculated based on the population data of each metropolitan area.
*All percentages may not total 100% due to rounding
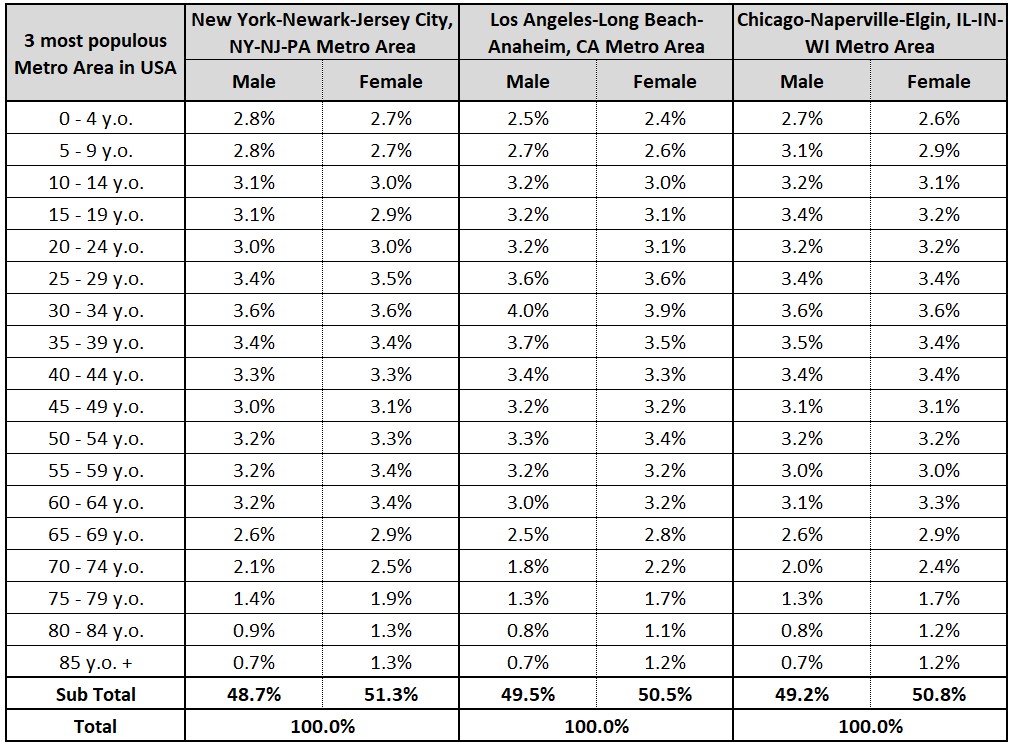
*The population composition is calculated based on the population data of each metropolitan area.
*All percentages may not total 100% due to rounding
---
For those interested in learning more about the “average American lifestyle,” please also check out this article.
What's the average American's life like? Understanding the “average” of America's diversifying consumers
・America that values the individual
・America that seeks rationality and efficiency
・Values placed on durable goods
etc.
*The population composition is calculated based on the population data of each metropolitan area.
*All percentages may not total 100% due to rounding
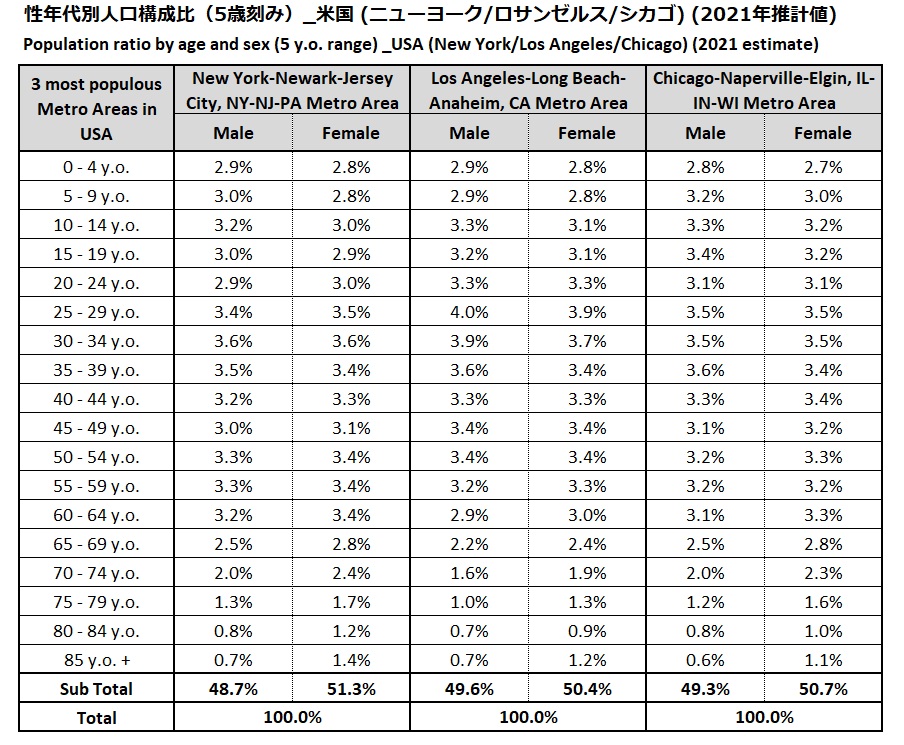
* 4 metropolitan areas are listed in descending order according to population from left to right.
* The population composition is calculated based on the population data of each metropolitan area.
* All percentages may not total 100% due to rounding.
About Reproduction and Quotation
Sign up for free
downloadDownload data