統計データ

Last updatedcalendar_month2020/07/30家計消費支出の項目別構成比

統計データ

Images

解説


---
海外生活者データで、意思決定をスマートに加速
Global Viewer
 
インテージがストックする11カ国(アジア・US)の生活者の様々な実態・意識に関するアンケートデータを用いて、ご課題に応じたレポートをご提供するサービス。
カバーしている項目は、各種商品・サービスカテゴリーに関する行動実態・意識、価値観・情報接触など400項目に及ぶ。
 
▼詳細はこちら
https://www.global-market-surfer.com/lp/gv/

引用

Reference
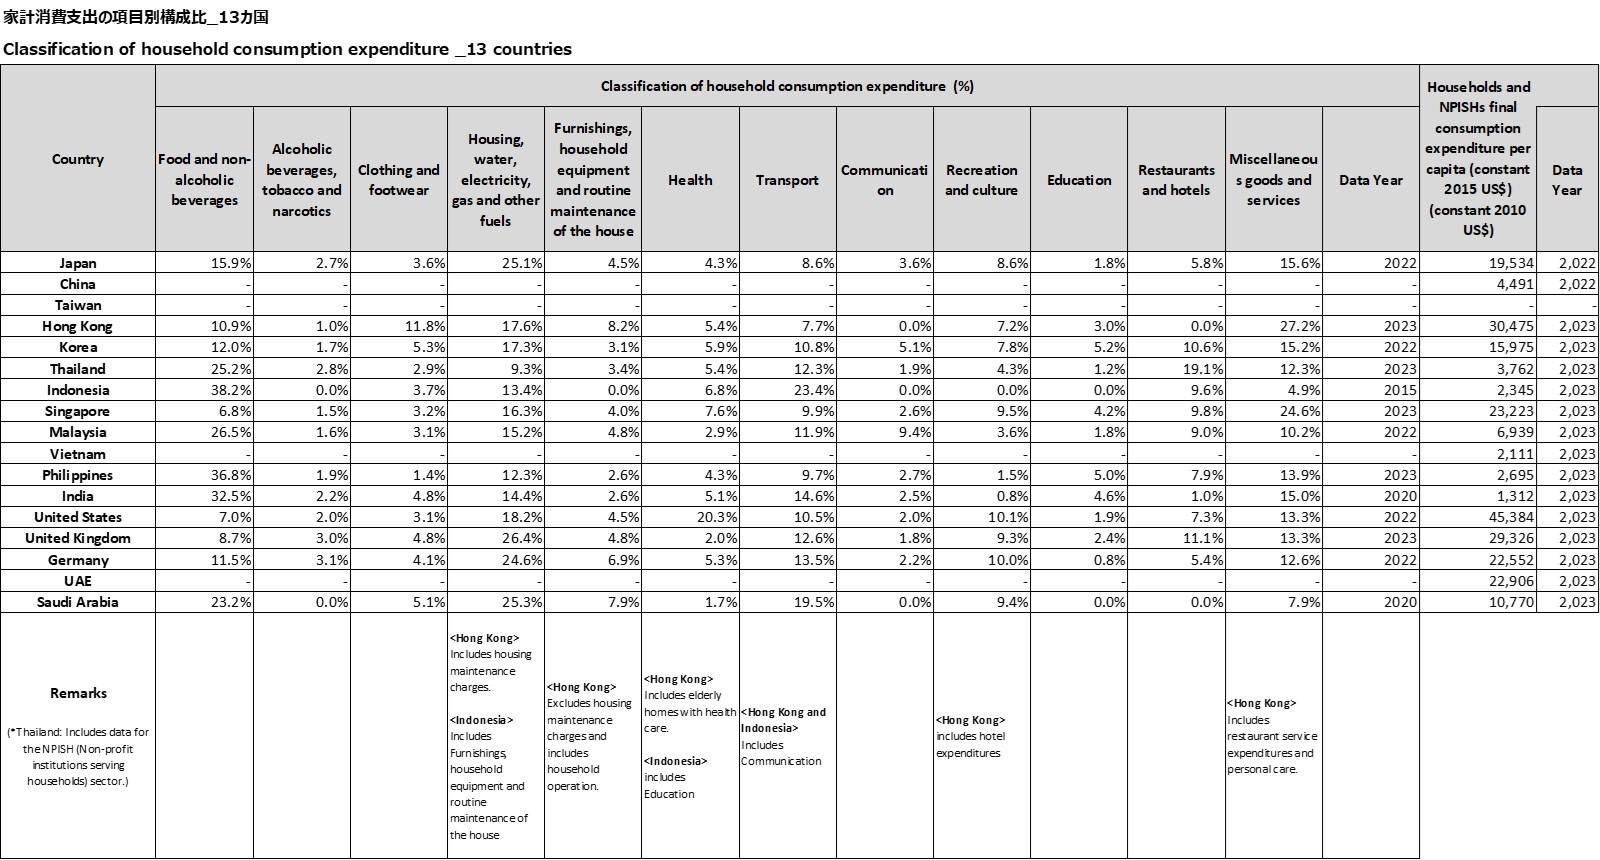
Classification of household consumption expenditure  (%)
United Nations Statistics Division (UNSD), "National Accounts Official Country Data", "Table 3.2 Individual consumption expenditure of households, NPISHs, and general government at current prices",
Retrieved Dec. 2024, from https://bit.ly/3coXAEg

Household consumption expenditure per capita 
World Bank, "World Development Indicators database", "Households and NPISHs final consumption expenditure per capita (constant 2015 US$)"
Retrieved Dec. 2024, from https://bit.ly/36SoEKZ

Images

解説

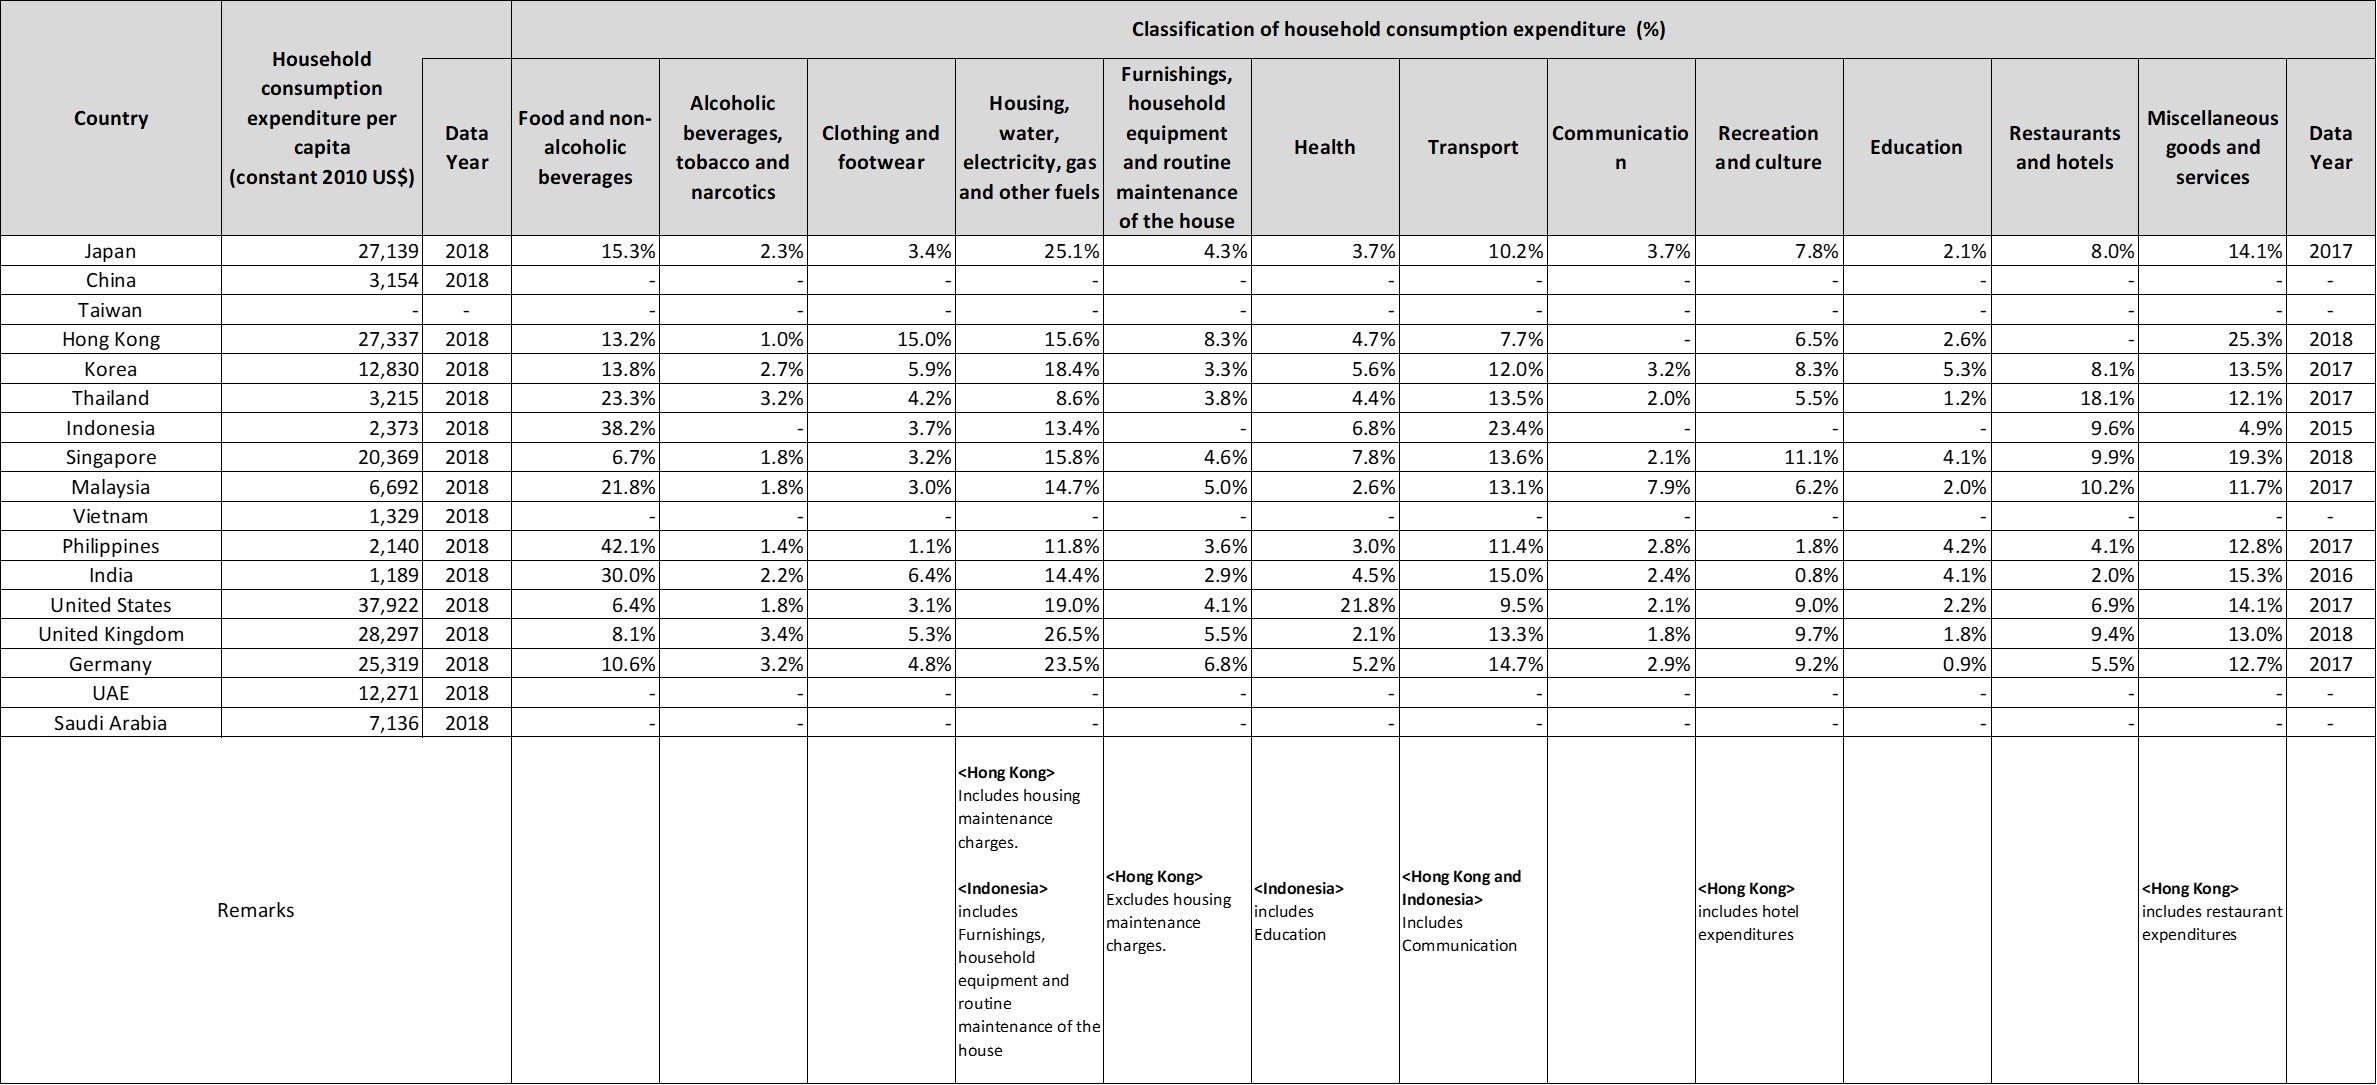
一人当たりの年間家計消費支出は、アメリカがトップで、37,922ドル。次いで、イギリス、香港、日本、ドイツと続く。 家計消費支出の構成比をみると、フィリピンは、食料品分野のみで40%を超えている。インドネシア、インドも30%を超えている。一方、シンガポール、アメリカ、イギリスは10%も満たない。 日本、イギリス、ドイツは、家賃・光熱費分野の構成比が最も高く、20%を超えている。 タイは、他国と比較すると、レストラン&ホテル分野の支出の構成比が高く、全体の18%を占めている。

引用

Reference Household consumption expenditure per capita World Bank, "World Development Indicators database", "Household final consumption expenditure per capita (constant 2010 US$)" Retrieved June 2, 2020, from https://bit.ly/36SoEKZ Classification of household consumption expenditure (%) United Nations Statistics Division (UNSD), "National Accounts Official Country Data", "Table 3.2 Individual consumption expenditure of households, NPISHs, and general government at current prices", Retrieved June 2, 2020, from https://bit.ly/3coXAEg

\ 会員登録で無料 /
downloadデータをダウンロード