Classification of household consumption expenditure
Reference
Classification of household consumption expenditure (%)
United Nations Statistics Division (UNSD), "National Accounts Official Country Data", "Table 3.2 Individual consumption expenditure of households, NPISHs, and general government at current prices",
Retrieved Dec. 2024, from https://bit.ly/3coXAEg
Household consumption expenditure per capita
World Bank, "World Development Indicators database", "Households and NPISHs final consumption expenditure per capita (constant 2015 US$)"
Retrieved Dec. 2024, from https://bit.ly/36SoEKZ
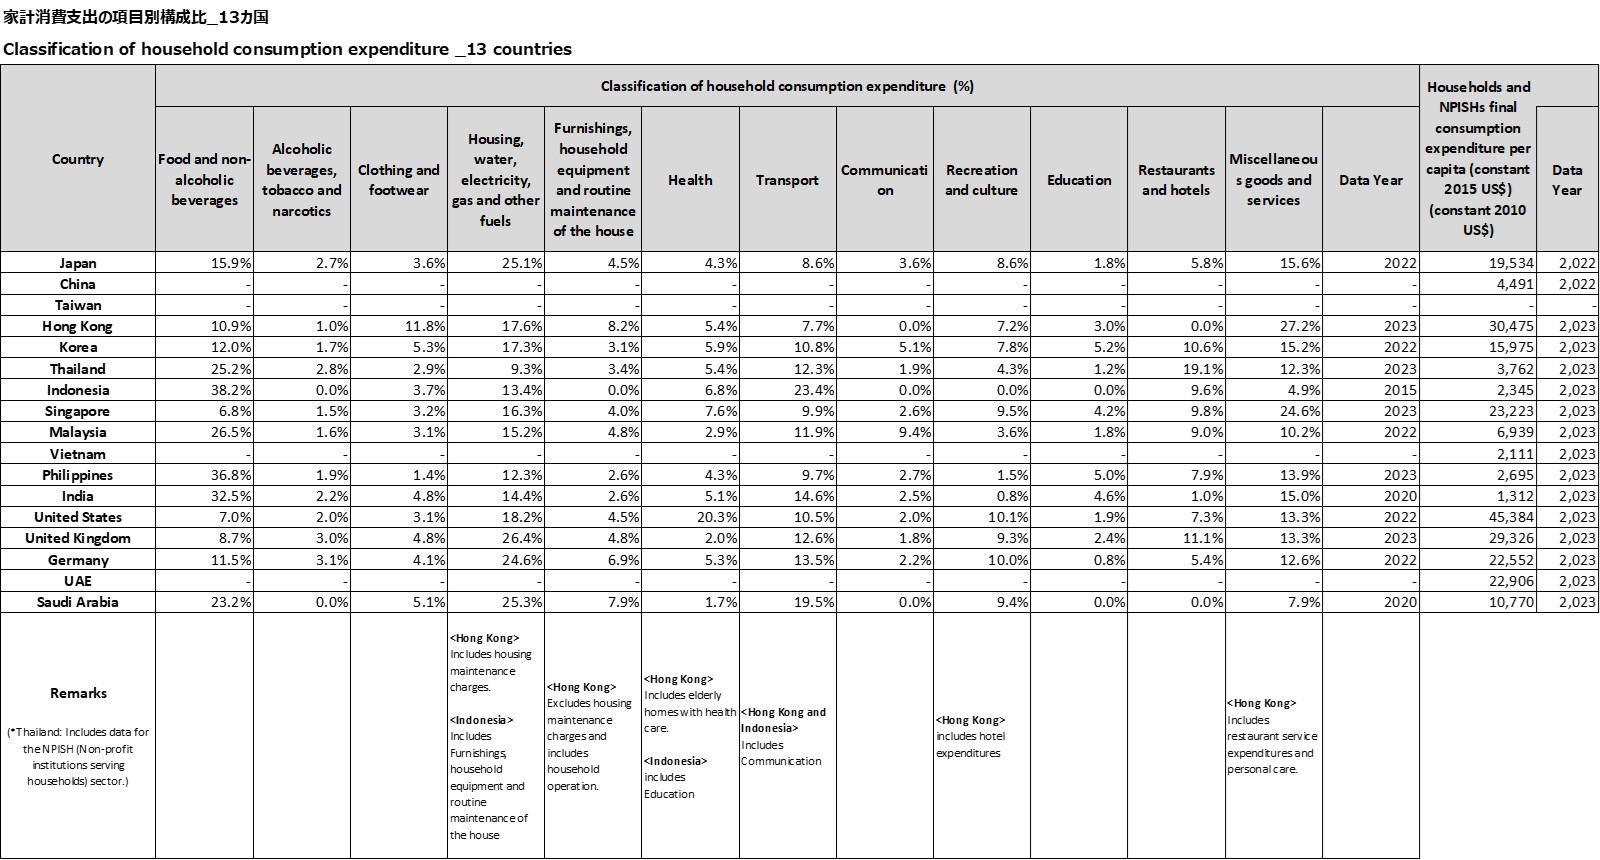
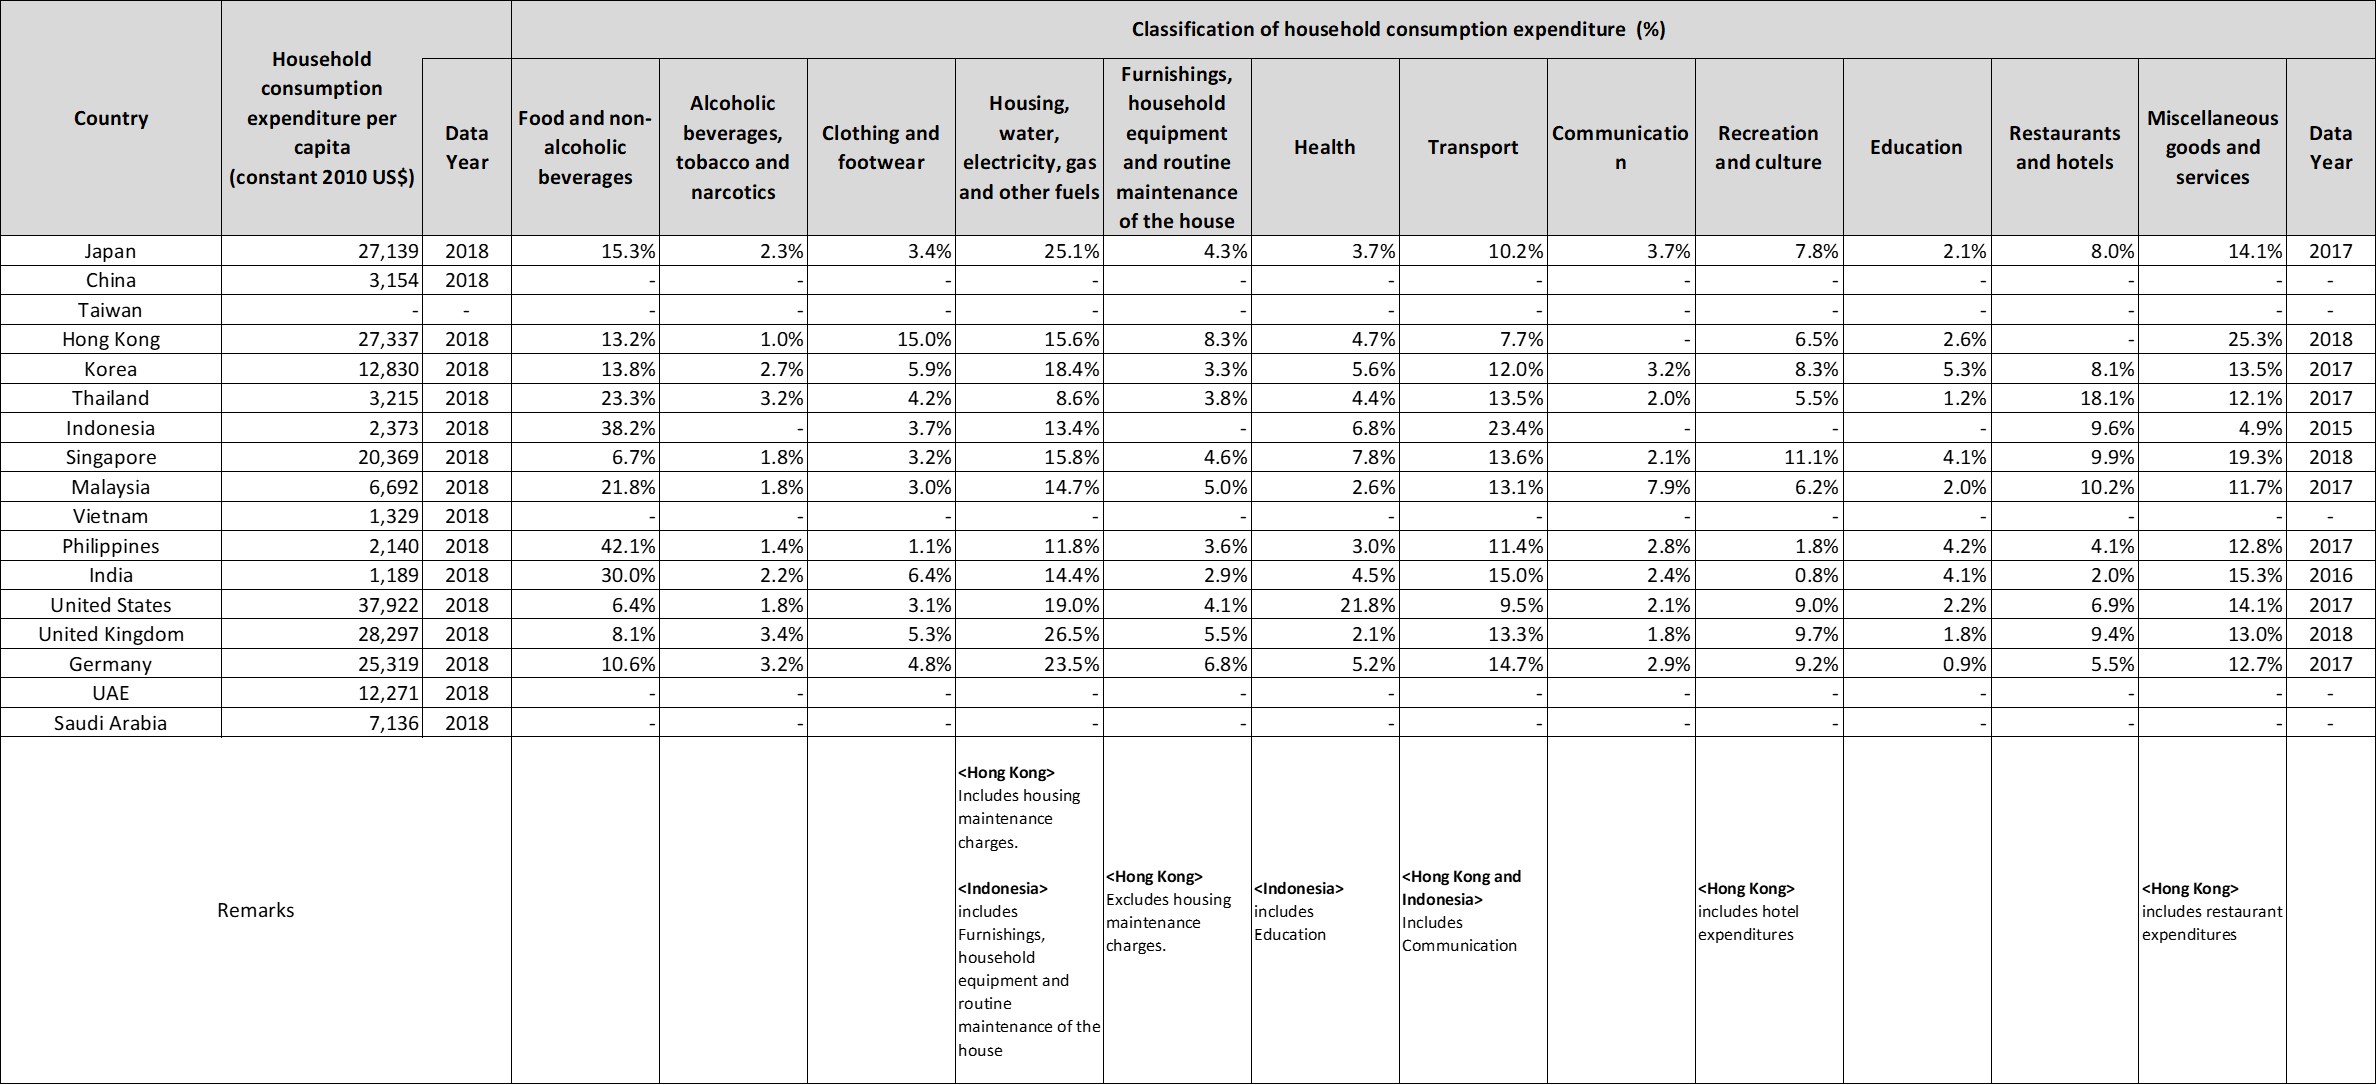
The U.S. tops the list of annual household consumption expenditures per capita, at $37,922. It is followed by the UK, Hong Kong, Japan and Germany. In terms of the share of household consumption expenditure, the Philippines has more than 40% in the food sector alone. Indonesia and India also have a share of over 30%. On the other hand, in Singapore, the U.S. and the UK, the food sector accounts for less than 10%. Japan, the UK and Germany have the highest share of rent and utility costs, at over 20%. In Thailand, compared to the other countries, the expenditure share of the restaurant and hotel sector is larger at 18% of the total.
Reference Household consumption expenditure per capita World Bank, "World Development Indicators database", "Household final consumption expenditure per capita constant 2010 US$)" Retrieved June 2, 2020, from https://bit.ly/36SoEKZ Classification of household consumption expenditure (%) United Nations Statistics Division (UNSD), "National Accounts Official Country Data", "Table 3.2 Individual consumption expenditure of households, NPISHs, and general government at current prices", Retrieved June 2, 2020, from (https://bit.ly/3coXAEg
- Income level
- 4103 Views