Commentary
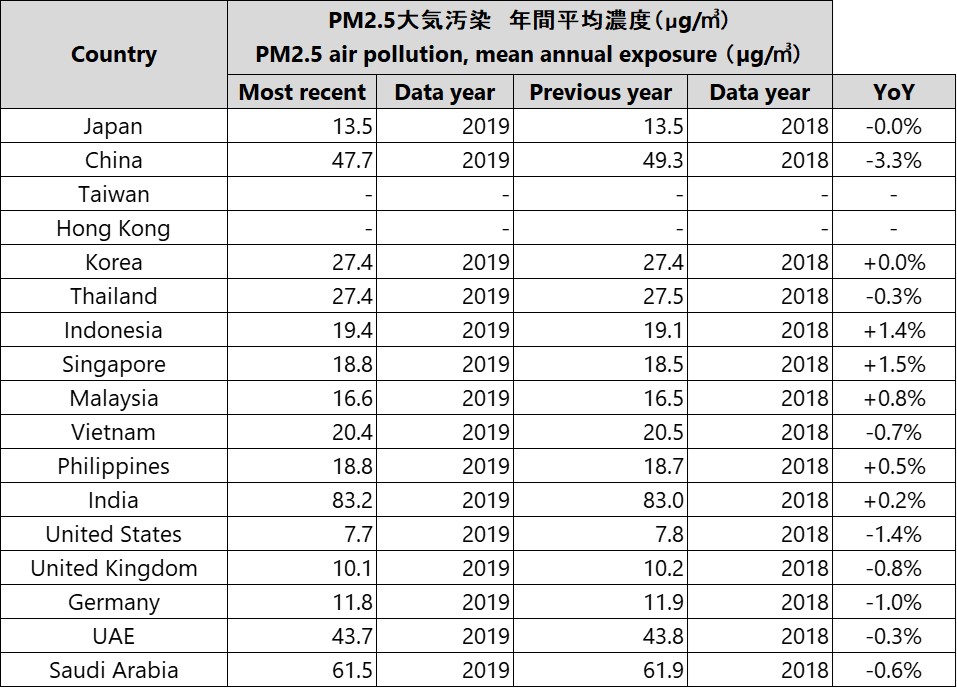
India has the highest annual average concentration of PM2.5 air pollution at 83.2 µg/m³. It is followed by Saudi Arabia and China.
All countries that met Japan’s annual average environmental standard (15 µg/m³ or less) are developed nations, with the following figures: Japan (13.5 µg/m³), Germany (11.8 µg/m³), the United Kingdom (10.1 µg/m³), and the United States (7.7 µg/m³).
Looking at the past two years, Singapore and Indonesia show an upward trend, while China, the United States, and Germany show a downward trend.
---
This article offers marketing tips for building empathy by examining Australian national character and consumer behavior.
National Character of Asian Countries: Australia Edition: A National Character Rooted in Mateship and a Coexistence Lifestyle
・A sense of camaraderie known as “Mateship” is deeply rooted not only in human connections but also in coexistence with nature.
・Sustainable product choices—such as reef-friendly sunscreen and eco-friendly detergents that protect the ocean—have become part of everyday life.
Reference
Reference
The World Bank "World Development Indicators" ”PM2.5 air pollution, mean annual exposure (micrograms per cubic meter)”
Retrieved August 2024, from http://bit.ly/3hbSb7q
Commentary
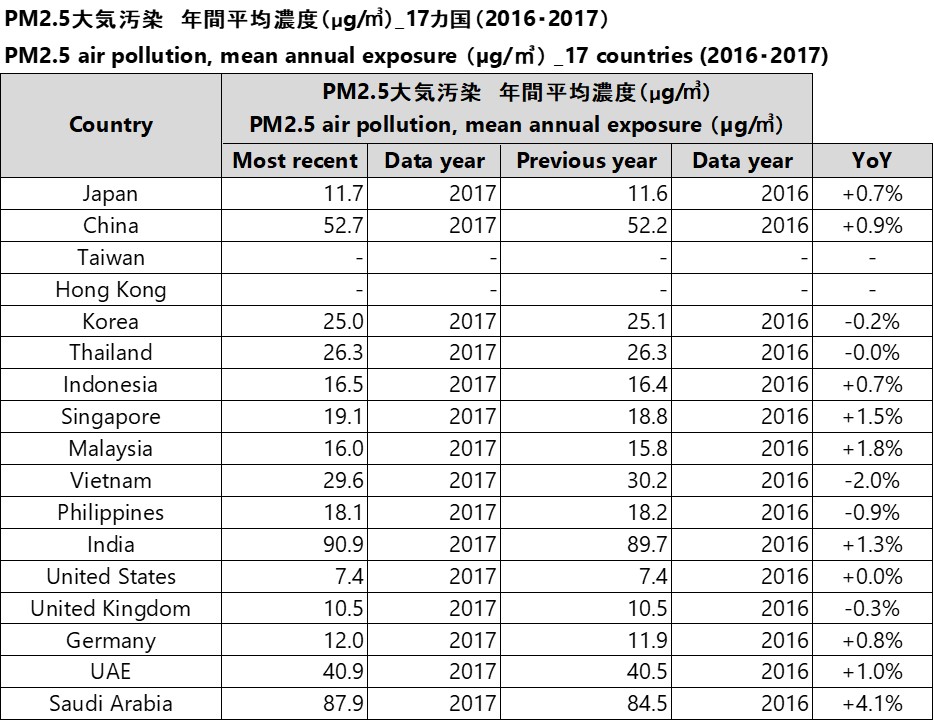
India tops the list of countries with the highest annual average concentration of PM2.5, at 90.9 µg/m3. This is followed by Saudi Arabia and China. All the countries that reached Japan's annual average environmental standard (15 µg/m3 or less) were developed countries, with the respective figures as follows: Japan (11.7 µg/m3), the United States (7.4 µg/m3), the United Kingdom (10.5 µg/m3), and Germany (12.0 µg/m3). Looking at the last two years, Saudi Arabia in the Middle East has deteriorated at a faster rate than the others, with a 4.1% increase. On the other hand, Vietnam, the Philippines, the United Kingdom, and South Korea are on a downward trend.
Reference
Reference The World Bank "World Development Indicators" ”PM2.5 air pollution, mean annual exposure (micrograms per cubic meter)” Retrieved December 23, 2020, from http://bit.ly/3hbSb7q