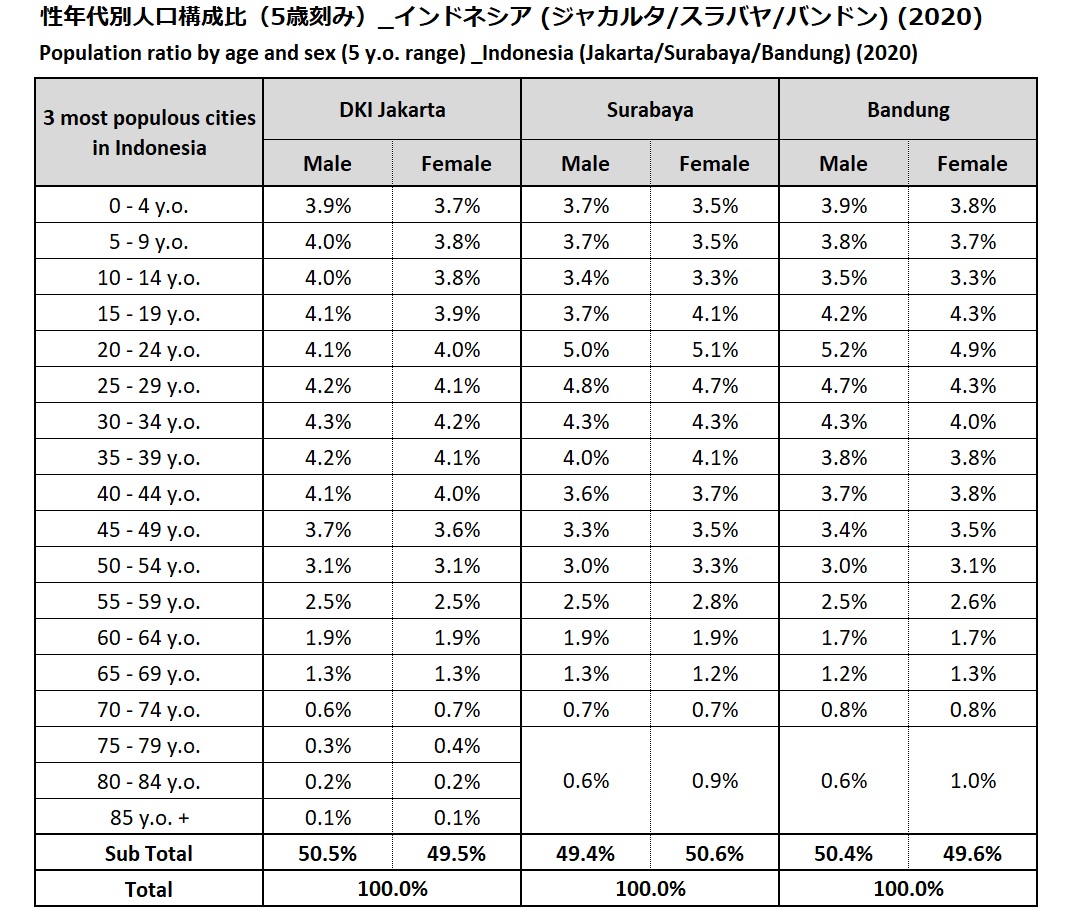
Last updatedcalendar_monthDec 30, 2022Population ratio by age and sex (5 y.o. range) _Indonesia (Jakarta/Surabaya/Bandung) (2020)
Statistics
Commentary
* 3 Cities are listed in descending order according to population from left to right.
* All percentages may not total 100% due to rounding.
---
With the world’s fourth-largest population and sustained GDP growth, Indonesia is Southeast Asia’s largest economy.
How well do you understand the “average Indonesian lifestyle and values”?
Drawing on various data sources, including Intage’s “Global Viewer” international consumer data, we will organize and explain the “average” that defines Indonesian consumers, as well as the latest trends revealed by this data.
Let’s Get to Know the “Average” Indonesian! Understanding the Lifestyle Through Climate, Culture, Halal, and Gen Z
・Lifestyle and Living Environment: Differences by Socioeconomic Class (SEC)
・Religious and Halal Considerations and Unique Consumer Behavior
Reference
Reference
Jakarta: Statistics Indonesia, "Statistical Yearbook of Indonesia 2021", Number of Population Results SP2020 male Female by Region, Age Group, 2020
Retrieved Dec. 30, 2022, from here
Surabaya: Statistics of Surabaya City, Statistics Table - Population, Projection of Surabaya Municipality Population, 2018 - 2020
Retrieved Dec. 30, 2022, from here
Bandung: Statistics of Bandung City, Statistics Table - Population by Age Group and Sex, 2018 - 2020
Retrieved Dec. 30, 2022, from here
About Reproduction and Quotation
Sign up for free
downloadDownload data