Last updatedcalendar_monthApr 06, 2026Intent to Purchase Processed Foods_China (Intage Global Viewer)
Statistics
Commentary
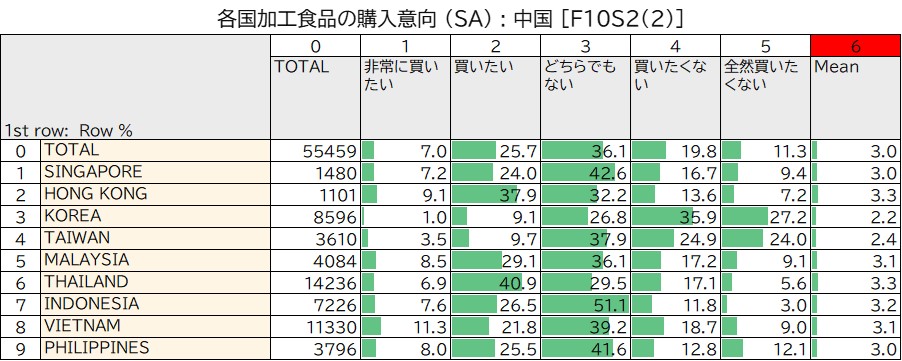
・The country with the highest percentage of respondents who said they “want to buy” Chinese processed foods was Thailand (40.9%), followed by Hong Kong (37.9%).
・The country with the highest percentage of respondents who said they “definitely do not want to buy” Chinese processed foods was South Korea (27.2%), followed by Taiwan (24.0%).
・The country with the highest percentage of respondents who answered “neither” regarding their intention to purchase Chinese processed foods was Indonesia (51.1%), followed by Singapore (42.6%).
Intage Global Viewer also provides the latest data for 2025/2026, as well as data on “food ingredients purchased in the past month” and more.
Click here for details.
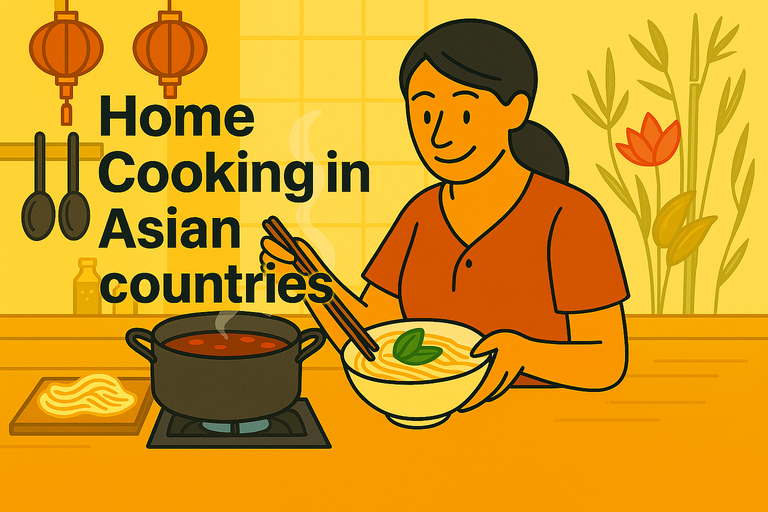
If you’d like to gain a deeper understanding of home cooking trends in various countries, please also check out the following article.
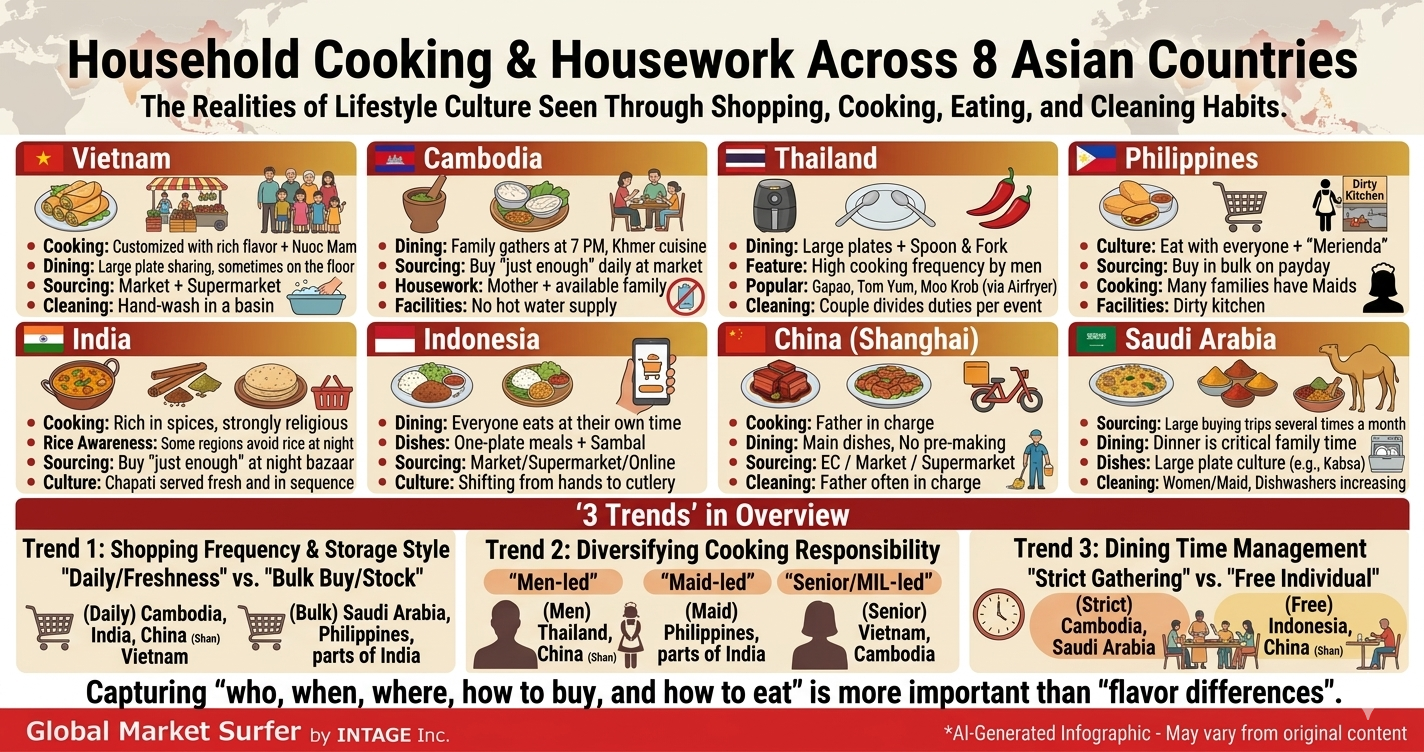
From Stocking Up on Ingredients to Cleaning Up: Home Cooking in 8 Asian Countries ~Three Trends Revealed Through Food Culture~
Food is an essential part of our lives. It strongly reflects a country’s culture, family structure, and infrastructure.
・Grocery shopping and food storage habits
・Changes in the kitchen’s main role
・Time management for increasingly diverse meals
Reference
Global Viewer (F10S2. Purchase Intentions for Processed Foods by Country (SA): China [F10S2(2)])
https://www.global-market-surfer.com/lp/gv/
About Reproduction and Quotation
Sign up for free
downloadDownload data
Related statistics
Related articles
-
Home cooking in Asian countries: How Cooking Frequency Reveals Differences in National Eating Habits
- sellAsia
- sellChina
- sellFood
- sellIndonesia
- sellTaiwan
- sellThailand
- sellUsage and altitude
- sellVietnam
calendar_monthFeb 12, 2026
-
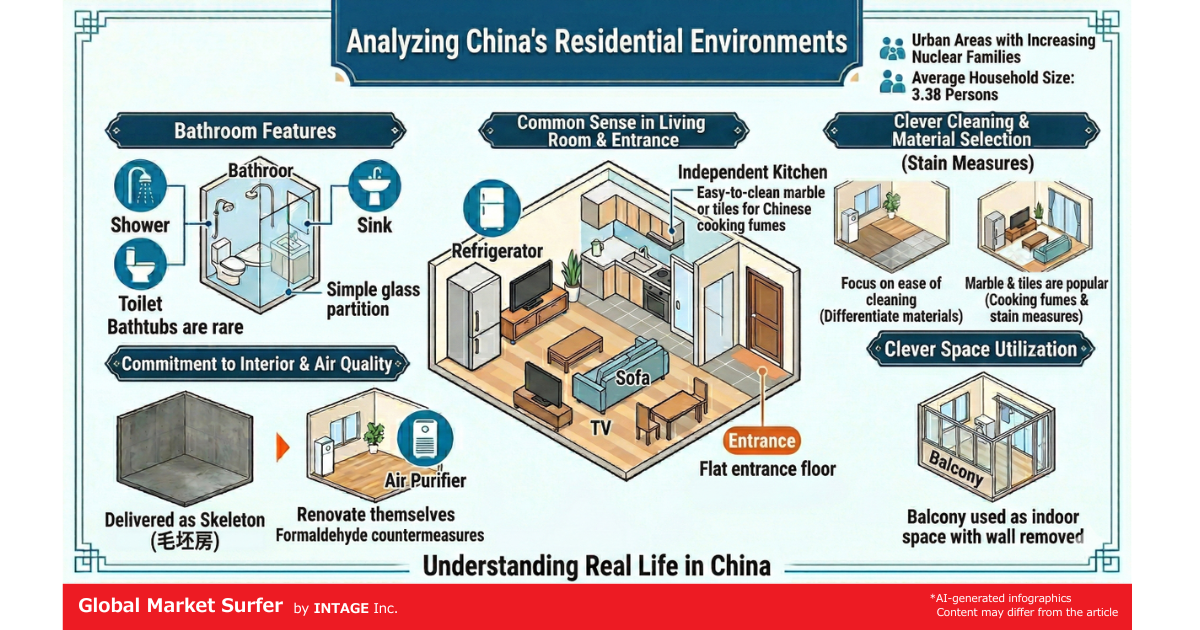
What is Real Life in China? Daily Habits and Current Trends Marketers Should Know
- sellBeauty & Personal Care
- sellChina
- sellConsumer Electronics
- sellCulture/Habit
- sellFurniture and home furnishings
- sellTypical
- sellUsage and altitude
calendar_monthFeb 26, 2026
-
From Stocking Up on Ingredients to Cleaning Up: Home Cooking in 8 Asian Countries ~Three Trends Revealed Through Food Culture~
- sellAsia
- sellCambodia
- sellChina
- sellCulture/Habit
- sellFood
- sellIndia
- sellIndonesia
- sellPhilippines
- sellRestaurant
- sellSaudi Arabia
- sellThailand
- sellTypical
- sellVietnam
calendar_monthMar 16, 2026