Search Results
Living Environment - 69 results
-
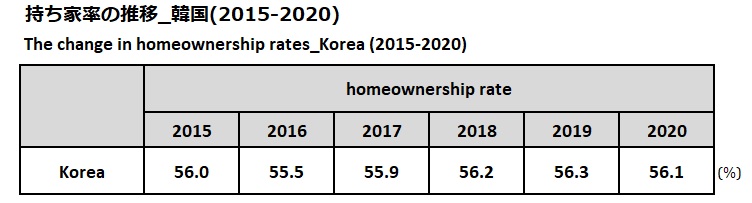
The change in homeownership rates_Korea
calendar_monthNov 24, 2022
* South Korea's homeownership rate for the six years from 2015 to 2020 has hovered between 55.5% and 56.3%.
-
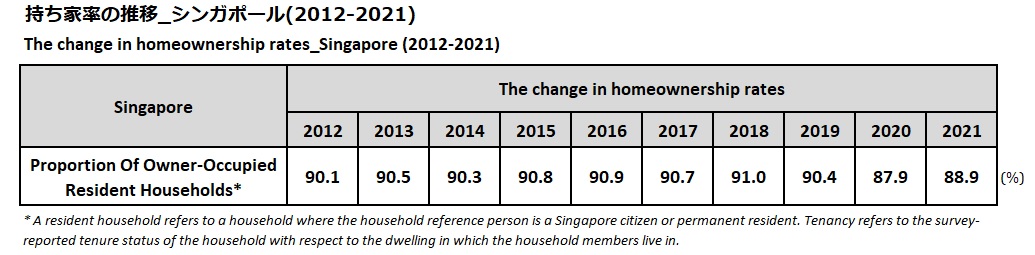
The change in homeownership rates_Singapore
calendar_monthNov 24, 2022
The homeownership rate in Singapore is extremely high at around 90%. This is because the government develops public housing and supplies them to citizens at low prices. This public housing is called "HDB (Housing & Development Board) flat", and the government implements the Central Provident Fund (CPF), a system that forces citizens to save a certain amount of income to purchase HDB housing. According to 2021 data**, 78.3% of Resident Households live in HDB flats, of which 90.9% live in their own properties.
-
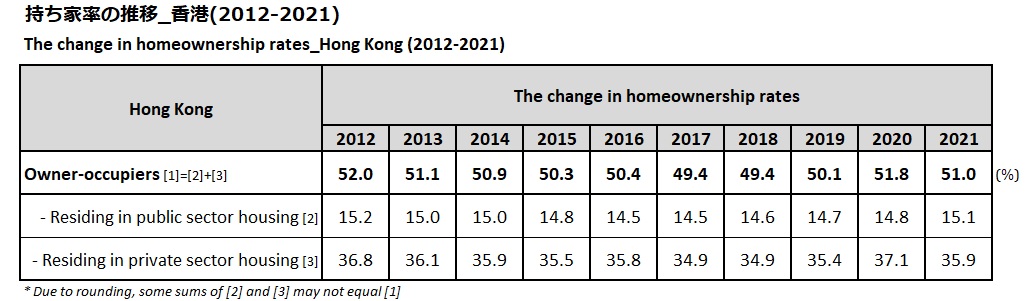
The change in homeownership rates_Hong Kong
calendar_monthNov 23, 2022
* Due to policies that encourage citizens to purchase public housing at low prices, Hong Kong's homeownership rate has exceeded 50% since 2000, rising to 54.3% in 2004. It dropped slightly below 50% in 2017-2018.
-
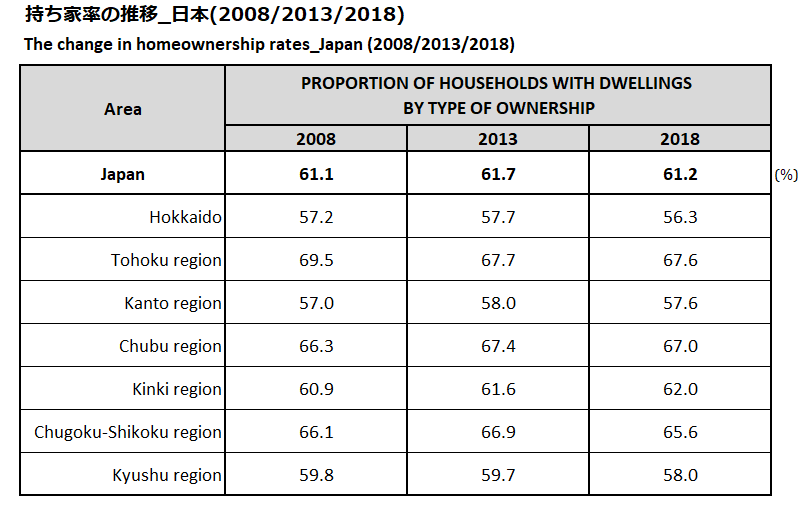
The change in homeownership rates_Japan (2008/2013/2018)
calendar_monthNov 22, 2022
* The homeownership rate in Japan has remained stable at the 61% level for the past decade.* By region, the homeownership rate in the Tohoku and Kyushu regions in 2018 decreased by 1.8 points compared to 2008. On the other hand, it increased by 1.1 points in the Kinki region.---This report focuses on “marriage”—a major turning point in life that significantly alters consumer behavior—and explores the cultures and customs deeply rooted in various Asian countries.How does consumer behavior change as people transition from single life to marriage and parenthood? By analyzing the significant event of marriage, we offer insights that will help you gain a more comprehensive understanding of Asian consumers. How Do “Marriages” Differ Across Asian Countries!? And the Consumption Behaviors That Come With Marriage ~ Bride Price? Groom Price? What About the Funds? ~・How are “weddings” conducted in various Asian countries?・Consumption Patterns Related to Marriage: Preparations and Purchases Made Upon Getting Marriedetc.
-
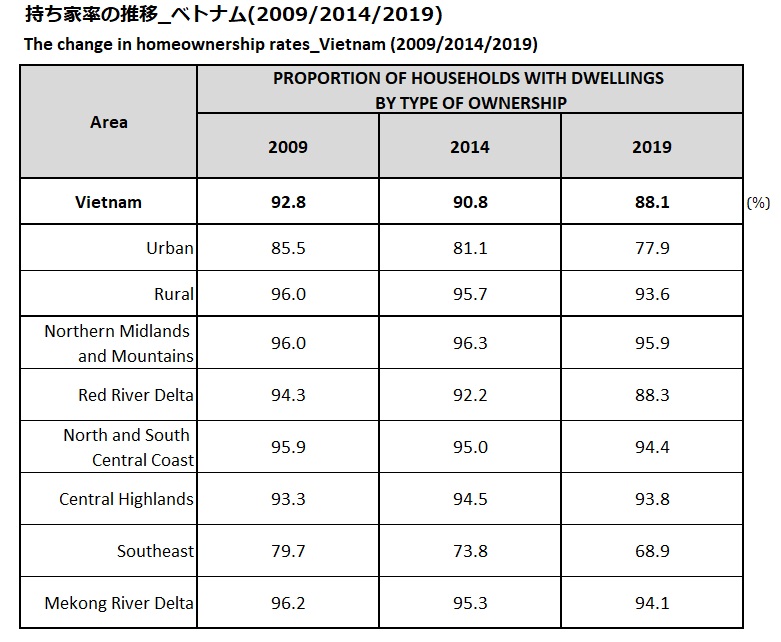
The change in homeownership rates_Vietnam (2009/2014/2019)
calendar_monthNov 21, 2022
* The homeownership rate in Vietnam is at a high level, but it is gradually declining. In particular, the decline in urban areas is conspicuous. * By region, the southeast, including Ho Chi Minh City, has the lowest homeownership rate, 19 percentage points below the national average. ---If you’d like to learn more about the “average lifestyle” of Vietnamese people, please also check out this article.Understanding the Average Vietnamese Consumer A Rapidly Growing Market Where “Youth” and “Practicality” Coexist: Decoding the Fundamentals of Vietnamese Consumers Through Data・A young average age and high birth rate・Vietnamese people who prioritize “practicality”・Growing health consciousnessand more
-
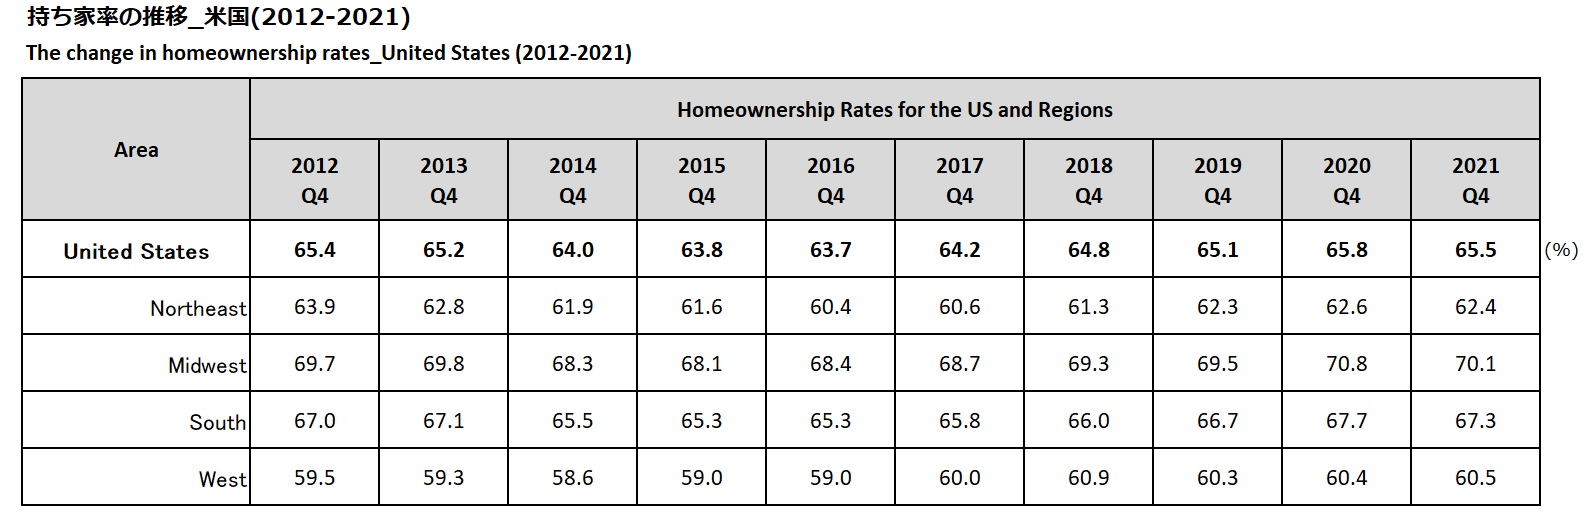
The change in homeownership rates_United States
calendar_monthNov 18, 2022
* The home ownership rate in the United States has hovered between 63.7% and 65.8% over the past decade. After rising to 69.2% in Q4 2004, it gradually declined due to the soaring housing prices associated with the rise in the rate of homeownership and the global financial crisis (2007). Since 2017, it has turned to rise. * By region, the homeownership rate is highest in the Midwest (70.1%) and lowest in the West (60.5%).
-
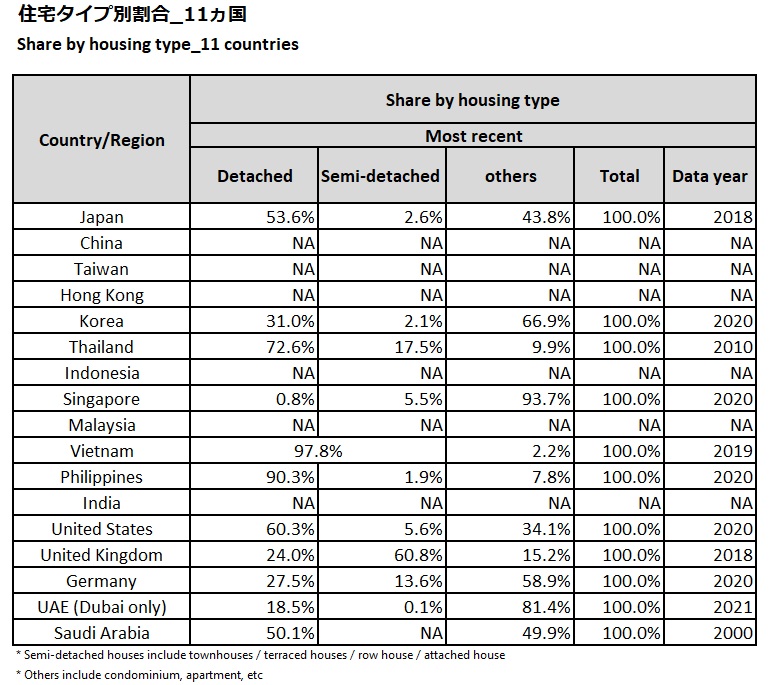
Share by housing type_11 countries
calendar_monthJul 18, 2022
In the 11 countries, Vietnam (97.8%) and the Philippines (92.2%) have the highest percentages of detached/semi-detacged homes. Singapore (0.8%) has the lowest percentage of detached houses, followed by the UAE (18.5%).
-
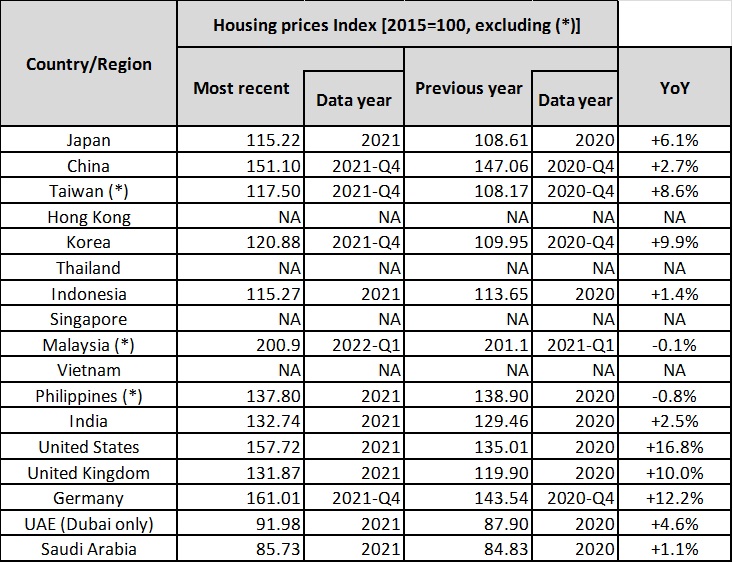
The rate of increase of Housing prices_13 countries
calendar_monthJun 16, 2022
Among 10 countries with the Index compared to 2015, housing prices in 2021 rose the most compared to 2015 in Germany (+ 61.0%), followed by the United States (+ 57.7%) and China (+ 51.1%). Malaysia (-21.7%), Saudi Arabia (-14.3%) and Dubai (-8.0%) had the lowest rates of increase. Among 13 countries, Housing prices in 2021 rose the most year-on-year in the United States (+ 16.8%), followed by Germany (+ 12.2%) and the United Kingdom (+ 10.0%). Index of South Korea (+ 9.9%) rose the most in Asia. On the other hand, Index of Philippines (-0.8%) and Malaysia (-0.1%) fell.
-
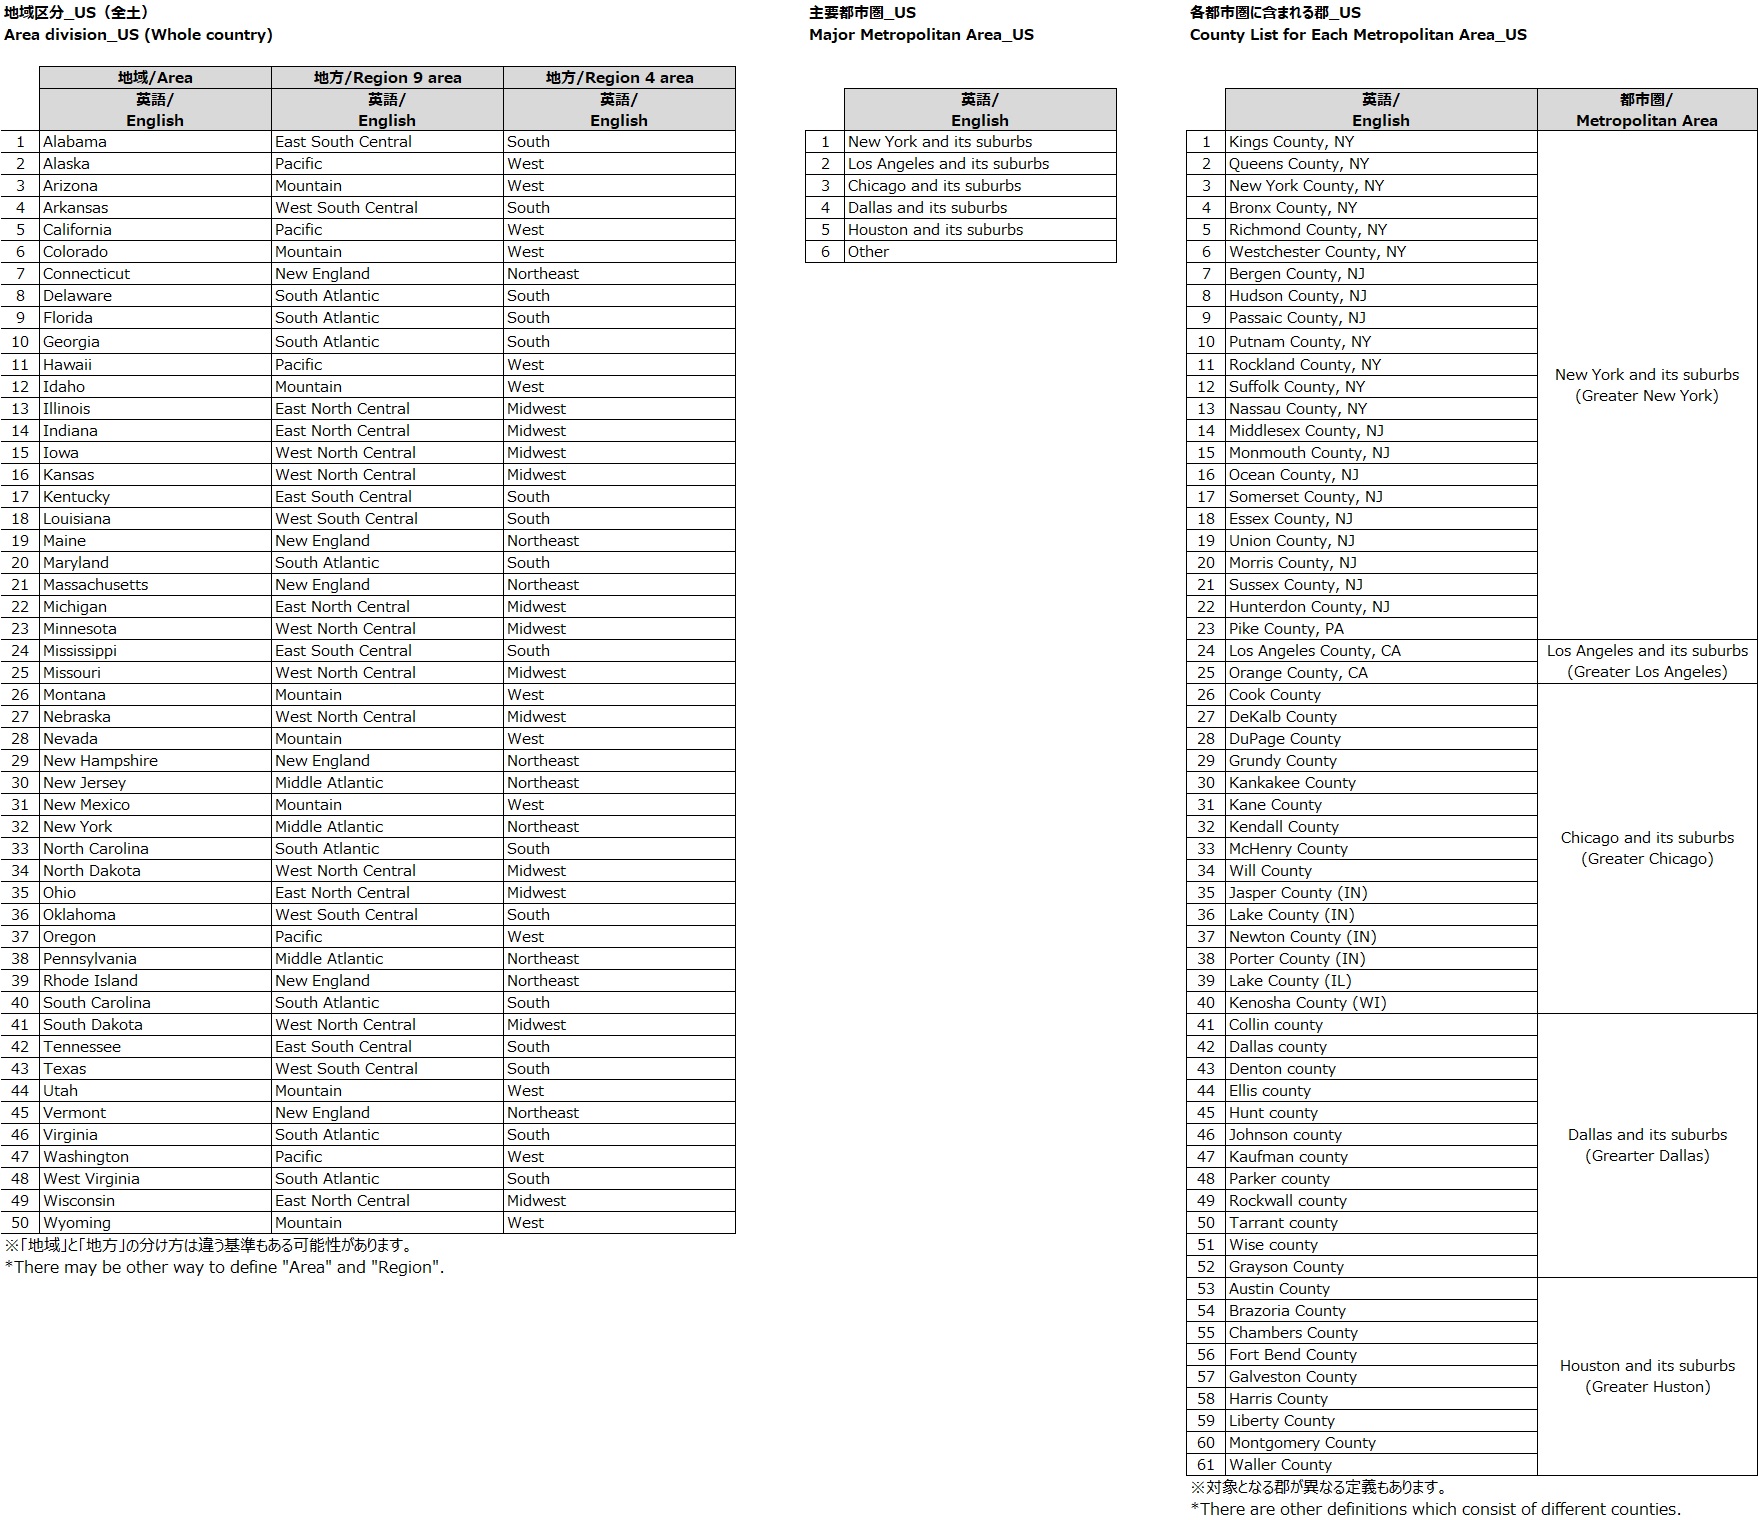
Area division&Major Metropolitan Area_USA
calendar_monthJun 30, 2021
***
-
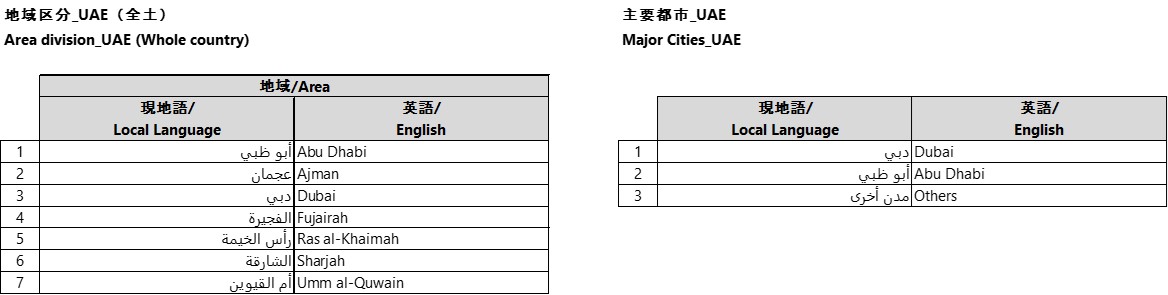
Area division&Major Cities_UAE
calendar_monthJun 29, 2021
***Through consumer surveys in the UAE and Saudi Arabia, as well as virtual home tours, we present a realistic look at daily life and consumer behavior in the Middle East.This article offers insights to deepen your understanding of the Middle Eastern market and explore new business opportunities. [UAE, Saudi Arabia] Experience virtual tour! ~New Market Opportunities~・Women’s increased participation in the workforce, changes in living environments, and characteristics of household chores and purchasing behavior・High trust in Japanese brands and growing interest in the latest technology and environmental considerations
-
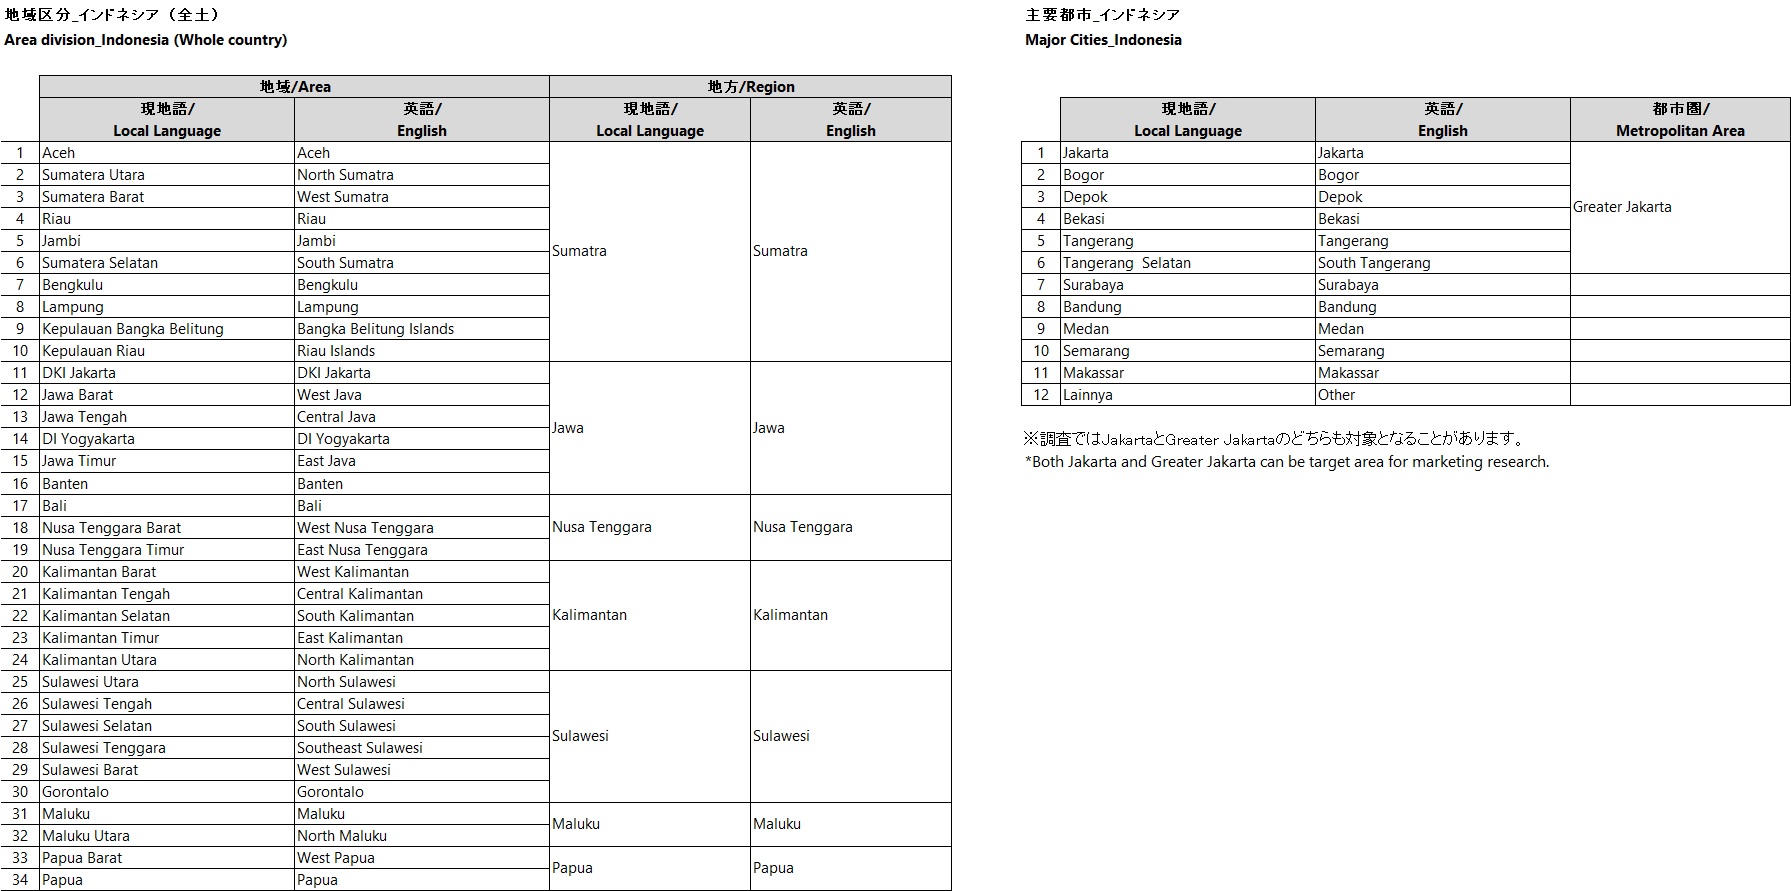
Area division&Major Cities_Indonesia
calendar_monthJun 29, 2021
***With the world’s fourth-largest population and sustained GDP growth, Indonesia is Southeast Asia’s largest economy.How well do you understand the “average Indonesian lifestyle and values”?Drawing on various data sources, including Intage’s “Global Viewer” international consumer data, we will organize and explain the “average” that defines Indonesian consumers, as well as the latest trends revealed by this data.Let’s Get to Know the “Average” Indonesian! Understanding the Lifestyle Through Climate, Culture, Halal, and Gen Z・Lifestyle and Living Environment: Differences by Socioeconomic Class (SEC)・Religious and Halal Considerations and Unique Consumer Behavior
-
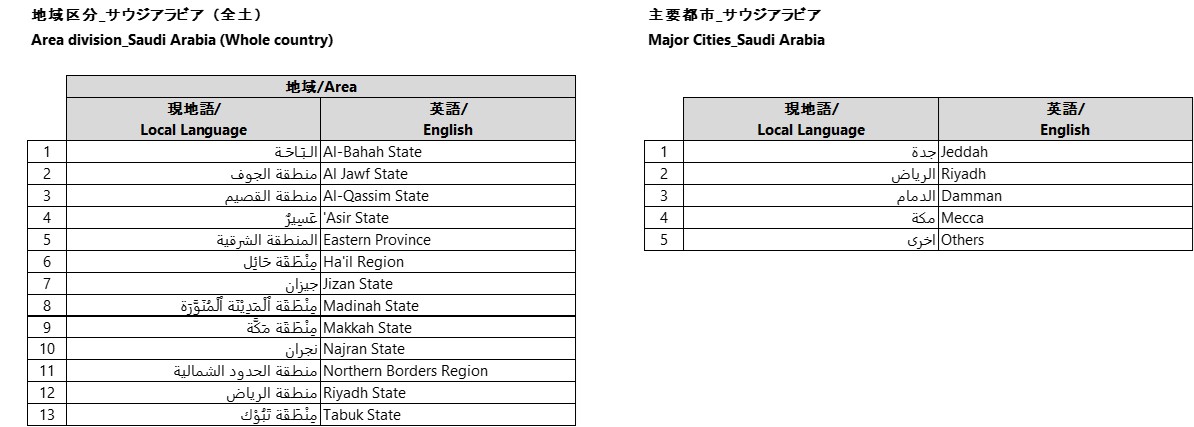
Area division&Major Cities_Saudi Arabia
calendar_monthJun 29, 2021
***Accelerate decision-making with smart overseas resident dataGlobal Viewer This service provides reports tailored to your issues using questionnaire data on various actual conditions and attitudes of sei-katsu-sha in 11 countries (Asia and US) stocked by INTAGE.The service covers 400 items, including actual behavioral conditions and awareness, values, and information contact related to various product and service categories. ▼Click here for detailshttps://www.global-market-surfer.com/lp/gv/