What's the average American's life like? Understanding the “average” of America's diversifying consumers
- Release date: Jan 13, 2026
- Update date: Feb 10, 2026
- 2422 Views

The United States is the world's largest consumer market.
However, the American market is characterized by being “vast, diverse, and highly unequal,” with consumer behavior varying significantly by region, ethnicity, and income level. This is precisely why it's crucial to first grasp the concept of the “average American” rather than immediately focusing on highly segmented groups.
Understanding the average provides a baseline for standard living standards, spending patterns, and purchasing channels, serving as the first step toward comprehending American consumers.
This article introduces the “average American lifestyle” based on data from Intage, Japan's largest market research firm. Please note that the “average” discussed here does not refer to a strict statistical mean but rather captures the overall tendencies of Americans.
目次
1. Understanding the “Average” in America from Statistical Data (Basic Profile of Americans)
(1) Demographics
(2) Households and Housing
(3) Income and Expenses
(4) Comparison of Labor-Related Matters
2. Lifestyle and Values
(1) Individualism-focused America
(2) Due to the demands of work, childcare, and other responsibilities, Americans seek rationality and efficiency.
(3) America that respects diversity
(4) Values Regarding Durable Goods
(5) The World of English
3. Summary
1. Understanding the “Average” in America from Statistical Data (Basic Profile of Americans)
First, let's get a broad picture of Americans by looking at key statistics.
(1) Demographics
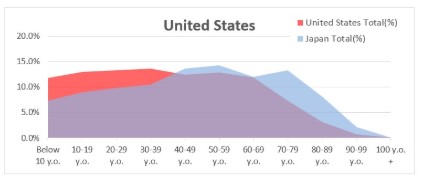
① Population by Sex and Age Group (10-Year Increments)
In the United States, the population size across age groups from under 10 to the 50s is relatively evenly distributed. Unlike Japan, where the population is skewed toward specific generations, a key feature is that the younger population under 40 also maintains a consistent volume. This demographic structure forms the foundation of the American market, where markets targeting a wide range of age groups coexist simultaneously.
For data on the U.S. population by age and gender, we provide free access to the information here.
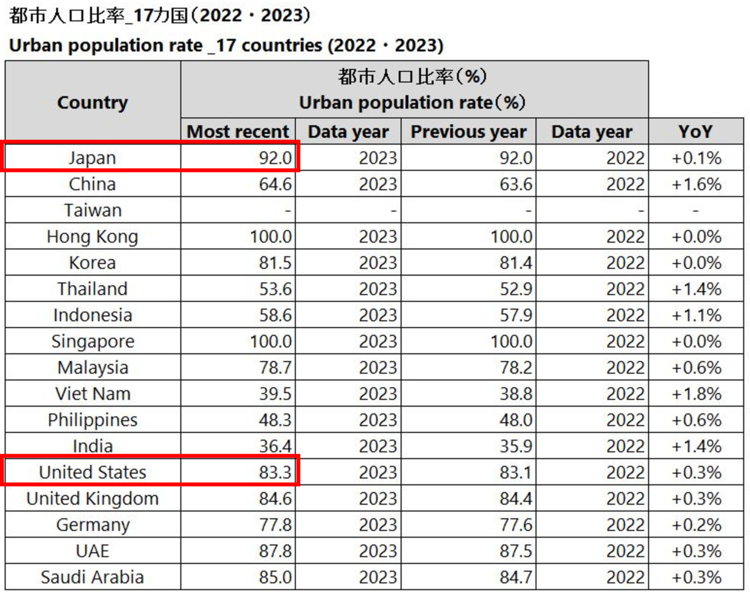
② Urban Population Ratio
While approximately 92% of Japan's population is concentrated in urban areas, the urban population ratio in the United States stands at only 83.3%. Compared to Japan, the United States has a higher proportion of its population residing in rural and suburban areas.
For the urban population ratios of 17 countries, we provide the data (free) here.
▶Related Data: Urban population rate _17 countries
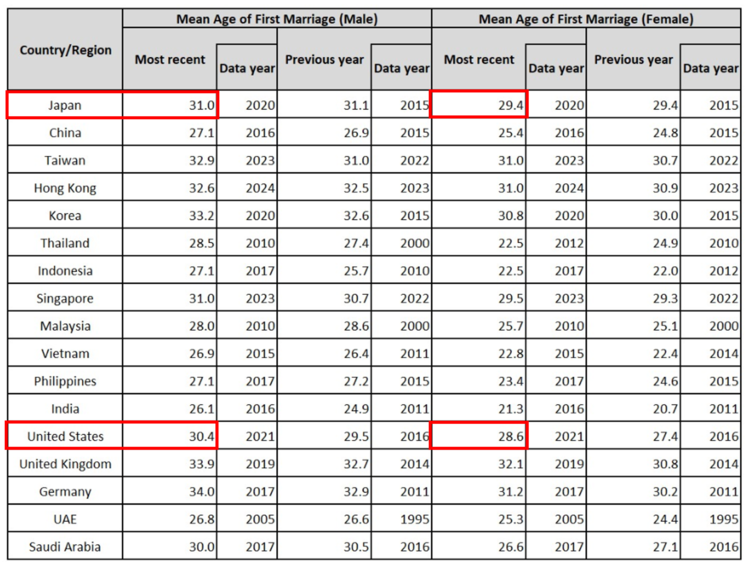
③ Average Age at First Marriage
The average age at first marriage in the United States is 30.4 years for men and 28.6 years for women. Compared to Japan (31.0 years for men, 29.4 years for women), the difference is not significant, suggesting that Japan and the United States share many similarities in terms of how life stages progress.
For data on the age at first marriage by gender, we provide it here (free of charge).
▶Related Data: Mean age of first marriage by sex
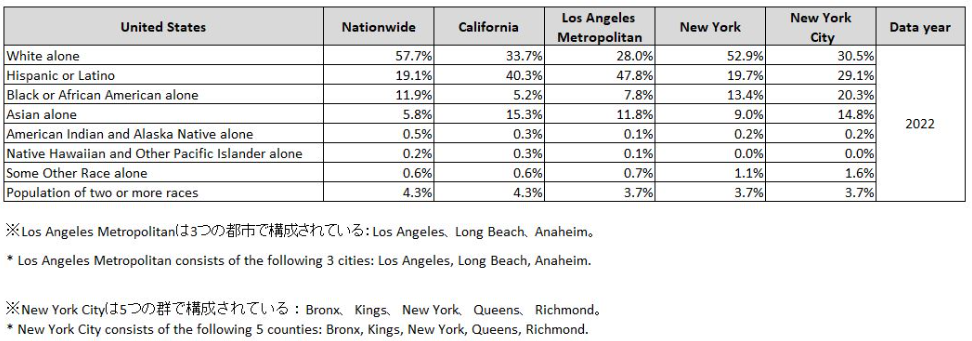
④ Racial and Ethnic Composition
Across the United States as a whole, whites constitute the largest group at 57.7%. However, racial and ethnic composition varies significantly by state, with California's white population at just 33.7%.
For data on the racial and ethnic composition of the United States, we provide free information here.
▶Related Data:Population ratio by ethnic groups _USA
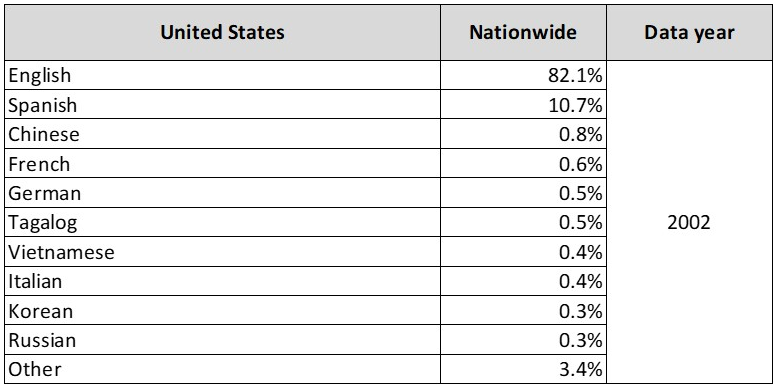
⑤ Population Composition by Language
While a certain number of people in the United States do not speak English or are not sufficiently proficient in it, the population composition by language shows that English speakers account for 82.1%. Therefore, English remains the fundamental language of communication.
For language-specific population composition ratios, we provide data (free of charge) here.
▶Related Data:Population ratio by language _ United States
(2) Households and Housing
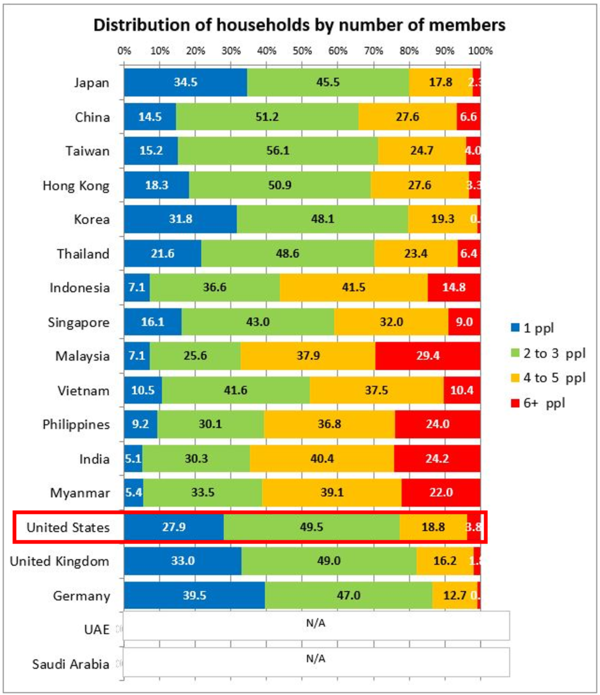
① Household Size Composition by Number of Members (16-Country Comparison)
Looking at household size in the United States, households with 2 to 3 members account for 49.5%, representing nearly half of all households. This distribution shows a similar trend to Japan's household size composition, with small households being the mainstream in both countries.
Regarding the composition ratio by household size, we provide data (free of charge) here.
② New vs. Existing Homes
Looking at housing consumption trends based on publicly available U.S. data, population mobility shows a movement away from major metropolitan areas, with job opportunities and livability being the primary factors driving relocation.
Regarding home ownership, single-family homes dominate, and a notable feature is the higher proportion of homes over 40 years old compared to Japan. In terms of durable goods ownership, homes often feature relatively spacious kitchen areas, and dishwasher ownership rates are higher than in Japan.
For more on American housing, check out this free report.
▶Related Report:Housing in the United States by Statistical Data
(3) Income and Expenses
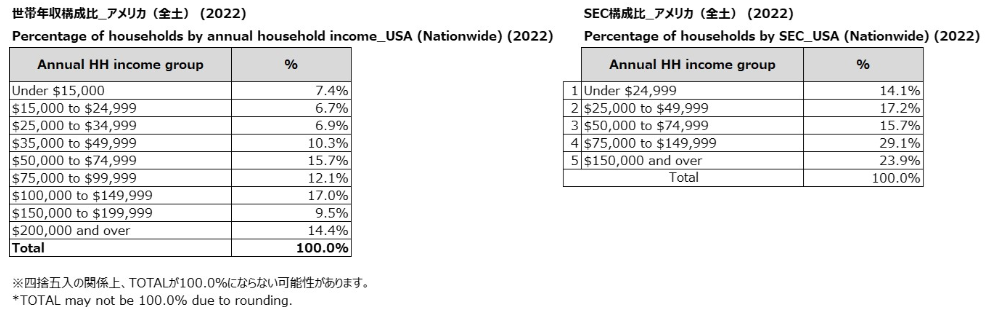
① Household Income and SEC Composition (U.S. Nationwide)
Looking at U.S. household annual income, the volume zone is between $75,000 and $149,000 (approximately ¥11.4 million to ¥22.8 million), accounting for about 30% of the total. Compared to Japan, the relatively high household income level is a defining characteristic of the U.S. market.
For household income and SEC composition ratios, we provide data (free of charge) here.
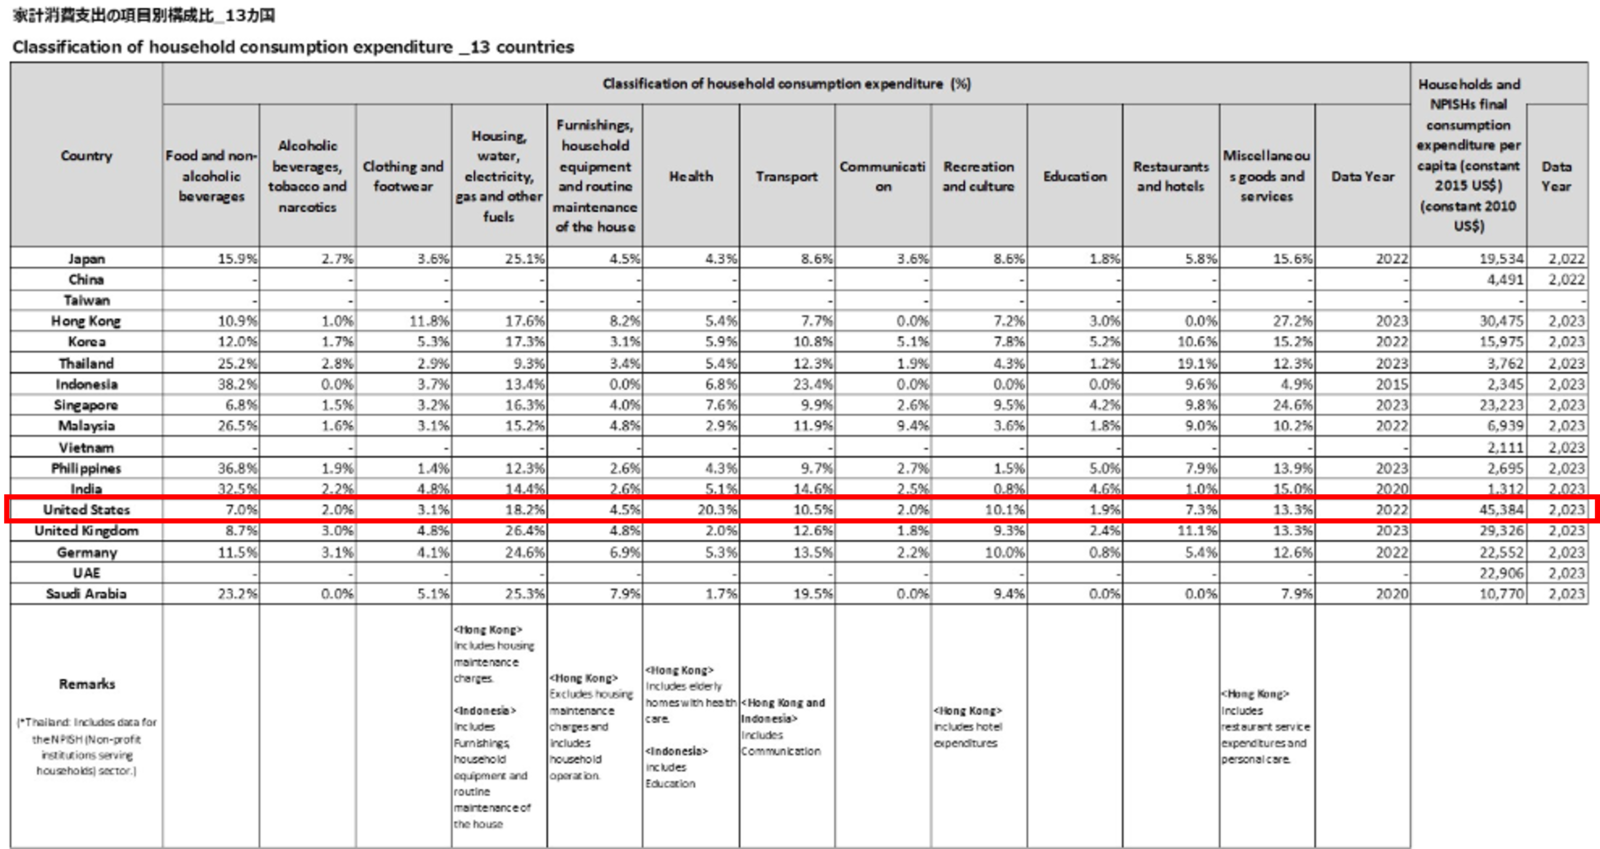
② Breakdown of (Average) Household Consumption Expenditures by Category
Because income levels are higher in the United States compared to Japan, total consumption expenditures also tend to be larger. Here, we examine how the expenditure composition differs from Japan's when total expenditures are set at 100.
First, the expenditure ratio for food is 15.9% in Japan, while in the United States it is 7.0%, less than half. On the other hand, healthcare expenditure is 20.3% in the United States, about five times Japan's 4.3%, highlighting the significantly larger share of household budgets allocated to medical and health-related costs.
Regarding the composition of household consumption expenditures, we provide data (free of charge) here.
▶Related Data:Classification of household consumption expenditure
(4) Comparison of Labor-Related Matters
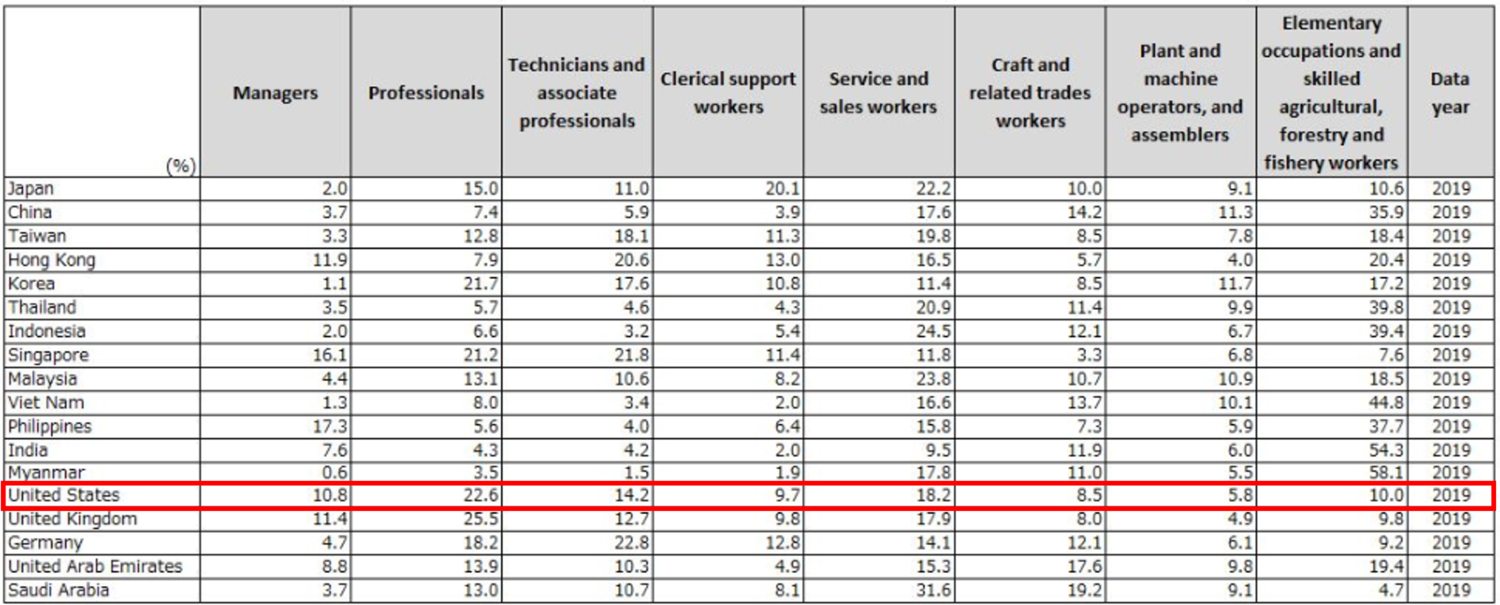
① Distribution of Employment by Occupation
Looking at the occupational composition of employment, the United States has a higher proportion of workers in “managerial positions” (Japan: 2.0%, U.S.: 10.8%) and “professional occupations” (Japan: 15.0%, U.S.: 22.6%) compared to Japan.
Conversely, the proportion of “non-managerial desk work” is 20.1% in Japan, while in the U.S. it is only 9.7%, roughly half that level. These figures suggest that in the U.S., the shift towards replacing routine clerical tasks with AI or outsourcing is more advanced, or exists within a structure more conducive to such advancement, compared to Japan.
For employment figures by occupation, we provide data (free of charge) here.
▶Related Data:Employment distribution by occupation
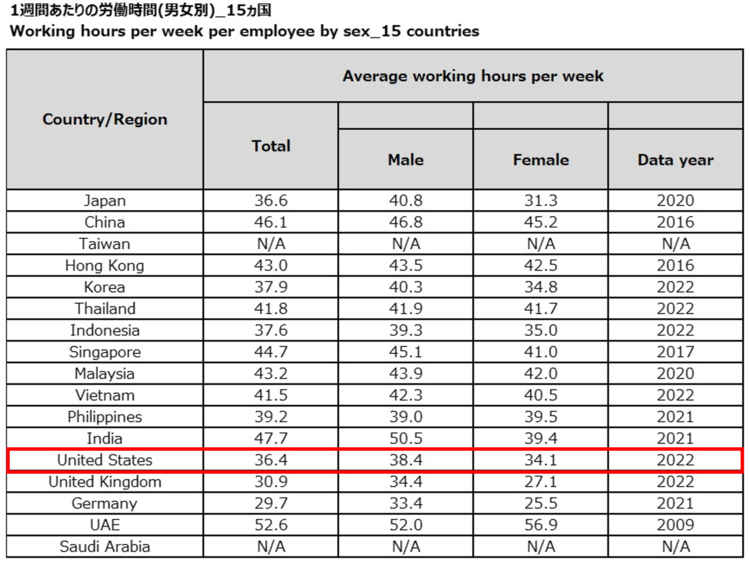
② Weekly Working Hours
The average weekly working hours in the United States are 36.4 hours, nearly the same as Japan's 36.6 hours. Both countries rank among those with relatively long working hours among developed nations, and the high workload is a common characteristic shared by Japan and the United States.
For employment by occupation, we provide data (free of charge) here.
▶Related Data:Working hours per week per employee by sex
2. Lifestyle and Values
(1) Individualism-focused America
The United States, built by immigrants from around the world, has a deeply rooted value of respecting the individual, partly due to its background as a multi-ethnic nation. Here, we examine how this characteristic manifests in daily life through the familiar examples of “child-rearing” and “refrigerators.”
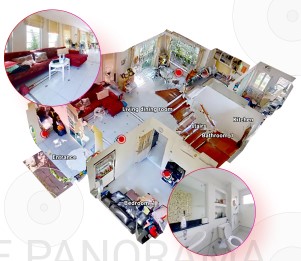
The formation of unique lifestyles and parenting philosophies amidst diverse cultures can be observed in actual photographs of homes captured in Intage's overseas consumer visual database, “Consumer Life Panorama” (commonly known as CLP).
First, regarding child-rearing. While Japan tends to emphasize cooperation, the United States places importance on fostering independence from early childhood. This mindset manifests even in infancy. While it's common in Japan to place a baby crib in the parents' bedroom, some American families give their infant their own room starting around one month old.
Differences also appear in how nighttime crying is handled. Parents in Japan often rush to their baby immediately, whereas in the US, it's more common to first observe the situation. Consequently, many American households install baby monitors in the infant's room to check on them from a distance.
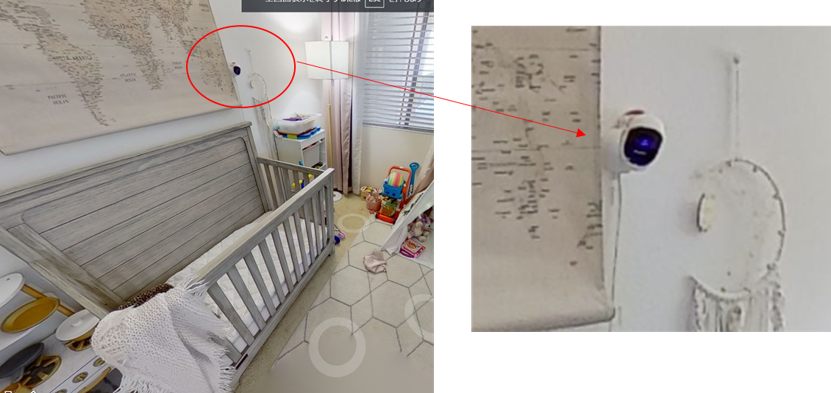
Baby's room and the baby monitor attached to the room (US_29)
Source: Consumer Life Panorama
What is Consumer Life Panorama?
This is a website-type database that has accumulated visual data on more than 1,000 sei-katsu-sha from 18 countries around the world. The database includes many 3D models of living environments and 2D data of items owned by each sei-katsu-sha, and is useful for understanding overseas sei-katsu-sha, which is difficult to grasp using only letters and numbers.
Using visual data such as those cited in this column,
Compare the differences in the attributes of overseas consumers
To get a realistic understanding of the actual usage of each category
To understand the overall lifestyle of target consumers
etc., can be utilized as a “no-go” home visit survey.
In Japanese children's rooms, it is common to incorporate the child's favorite characters or hobby items as “part” of the room, whereas in the United States, there is a tendency to create the entire space around a theme or motif the child loves.
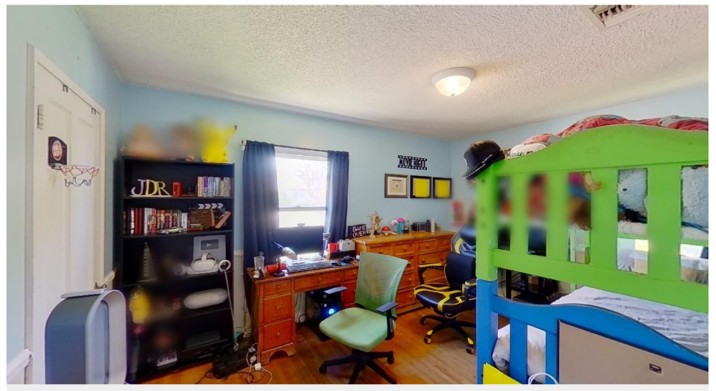
A child's room in an American household. Features a gaming PC and chair.
Source: INTAGE Consumer Life Panorama
The emphasis on “cherishing one's preferences and expressing individuality” from early childhood reflects the uniquely American individualistic values in parenting.
For more details on American parenting, see this article.
▶Related Article:[U.S: World Residence Tour] The U.S-style parenting with a high sense of independence
▶Related Article:[US] Parenting Values from an American Child's Room
In America, where children are raised respecting individuality, this value is reflected even in the everyday use of the indispensable refrigerator.
Compared to Japan, American single-family homes tend to be larger (about 2.7 times the size of Tokyo homes), with more spacious and open floor plans. Furthermore, since used homes make up about 80% of the market, many households remodel their kitchens or make DIY improvements.
Looking at CLP photos, we see households owning two refrigerators: one in the kitchen and another placed in the garage or basement. The second refrigerator serves purposes like “storing drinks for dad to enjoy while watching football in the basement” or “keeping bulk-purchased frozen foods and stock ingredients in the garage.”
This practice of using different refrigerators based on the user and purpose is a prime example of the American lifestyle culture that truly respects the individual.
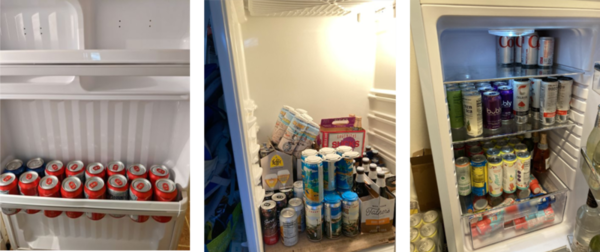
(Photo) Example of use as a dedicated beverage
Source: Intage Consumer Life Panorama
For more details about American refrigerators, please refer to this article.
(2) Due to the demands of work, childcare, and other responsibilities, Americans seek rationality and efficiency.
Looking at the structure of American retail, a focus on rationality and efficiency, aiming to maximize profits, is evident throughout. This structure aligns well with the behavioral characteristics of busy American consumers, often juggling work and childcare. Here are some representative examples.
Since the COVID-19 pandemic, many companies and employees have continued to explore work styles different from those before the pandemic. Among these, services in the retail and food service industries have been significantly impacted.
One example is the brick-and-mortar “Amazon Fresh” supermarket. Simply place items into a shopping cart equipped with four cameras and a barcode reader, and the purchased items are automatically registered on the screen, eliminating the need for additional scanning at the register. This allows for a smooth shopping experience without waiting in line to pay. Furthermore, using the Amazon app, you can review your purchase history as a substitute for a receipt.
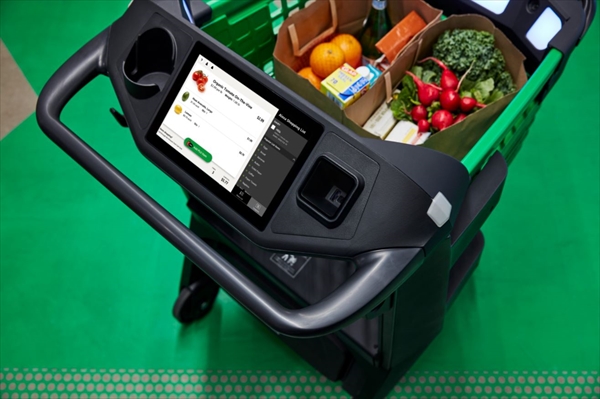
Photo: Amazon Fresh shopping cart “Amazon Dash Cart”
Source: Amazon Press Center
For a detailed introduction to the business models of the U.S. retail and food service industries, please refer to this article.
For more details on the characteristics of major retail stores in Los Angeles and New York, as well as stores where Amazon operates, please refer to this report (free).
▶Related Report:2023 US Retail Store Tour Report (LA, NY)
Next up is the battery electric vehicle (BEV), a car that runs solely on electricity without using gasoline. As carbon neutrality advances, particularly in developed nations, BEV adoption is accelerating—for instance, new BEV sales in California, USA, now exceed 20% of the market. Here, we analyze the background of this trend using consumer profiles from CLP's database.
Compared to gasoline vehicles, BEVs carry a higher purchase price, suggesting they are primarily owned by households with relatively higher income levels. A common characteristic among BEV owners identified in CLP's analysis is that they live with “small children” or “pets.” In such households, BEV features like quiet operation during driving and remote climate control—allowing users to adjust the interior temperature from afar—are likely valued. Indeed, Tesla offers features like “Dog Mode” for pets waiting in the car, addressing specific consumer needs. Further exploring the relationship between pet ownership and EV ownership could lead to new feature development, service design, and the discovery of compelling selling points.
Furthermore, the fact that many BEV owners live in single-family homes suggests they have an environment conducive to installing home charging equipment, which is likely another factor driving adoption.
Furthermore, CLP data reveals that BEV owners tend to be open to new things, lead active and healthy lifestyles, and prioritize balancing environmental protection with improved quality of life. They likely pursue rationality and efficiency in daily life, considering integration with smart homes and energy management.
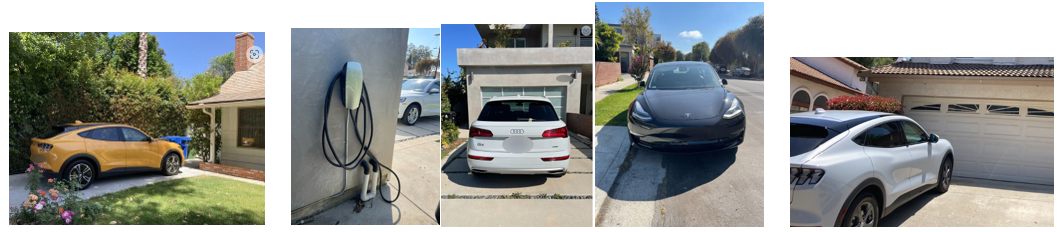
Reference: INTAGE Consumer Life Panorama
For details on the daily lives of American BEV users, please refer to this article.
Now, what about household chores and childcare?
In the United States, utilizing babysitters and nannies is more common compared to Japan, with over 70% of households using them at least once a month.
Furthermore, it's not uncommon for families to outsource not only childcare but also household tasks like cleaning to external services. Through this outsourcing, they reduce their household burden and instead prioritize their own time and time spent with family.
▶Related Report: Values Revealed Through American Homes (Virtual Home Tour)
(3) America that respects diversity
In the United States, home to diverse ethnic groups, food culture is incredibly broad. Supermarkets, essential to daily life, have also changed and evolved to meet the needs of local residents.
Los Angeles, in particular, has seen rapid ethnic diversification. Numerous supermarkets cater to the distinct food cultures of Japanese, Chinese, Korean, Hispanic, and other ethnic groups.
Furthermore, as an example of food unique to America's respect for diversity, “fusion cuisine” has emerged, blending dishes from different ethnic backgrounds.
Deepening our understanding of Americans, who keenly grasp consumers' changing needs and create new genres and values, will provide important clues for identifying future business opportunities.

Purchases at NIJIYA ※ Excellent selection of fish
For more details on the diversity of American supermarkets, please see this article.
As an example symbolizing cultural diversity, we introduce the “LA Anime Expo.”
The Anime Expo venue is overwhelmingly filled with teenagers and young adults in their twenties, creating an event enveloped in positive energy.
Compared to Japan, the American Anime Expo combines elements of an anime event, a cosplay event, and a Comic Market, resulting in a highly entertaining and vibrant atmosphere.
The expansion of subscription services like Netflix and Crunchyroll has increased opportunities to watch anime, leading to the widespread adoption of “Anime” as the English term for Japanese animation.
Thus, the position of Japanese anime in the United States is shifting from a niche “otaku” culture enjoyed by a select group of fans to a more mainstream culture centered around young people.
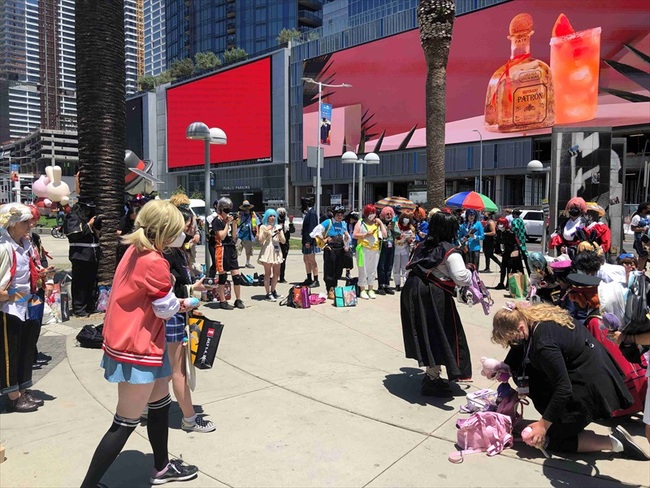
Photo: Taken by the author of this article outside the venue
For more details about Anime Expo in the United States, please refer to this article.
(4) Values Regarding Durable Goods
How do Americans perceive durable goods (goods used repeatedly over a long period)? Here, based on quantitative data and qualitative data (360-degree living environment data) held by INTAGE, we examine their values regarding “housing” in particular.
The data reveals that Americans move frequently, averaging about 6 to 7 times after graduating from college. This indicates that homes are seen as something that changes according to life stages.
Furthermore, housing is recognized both as a “place to live” and as an “asset,” leading to a tendency to prefer purchasing over renting whenever possible. The perception that housing prices will rise long-term likely reinforces this mindset.
Additionally, as mentioned in the previous section “2 (1),” pre-owned homes account for about 80% of the U.S. market, making the value of “buying a home pre-owned” commonplace.
For information on homeownership in the United States, please refer to this report (free).
▶Related Report: Values Revealed Through American Homes (Virtual Home Tour)
Next, we examine values regarding automobiles.
As introduced in the preceding “2 (2),” while battery electric vehicles (BEVs) are gaining traction, what the American market demands from Japanese BEVs is “Japanese car characteristics” such as being Affordable and Reliable.
While BEV adoption is progressing in the U.S., many consumers still feel that BEVs meeting conditions like “affordable pricing”
sufficient driving range, and minimal maintenance concerns.
Therefore, if Japanese automakers can offer mid-range BEV models at an affordable price point, with excellent durability and quality, they could have a significant opportunity to expand BEV market share in the U.S.
For more details on battery electric vehicles, please refer to this article.
(5) The World of English
English spoken worldwide is broadly divided into “American English” and “British English.” So, which is considered the mainstream? Also, how do countries differ in their understanding and perception of English?
Looking at survey results regarding perceptions of English in various countries, it was found that Americans recognize “American English as having clearer pronunciation and being more approachable compared to other English spoken in English-speaking countries.”

For more details on English, please refer to this article.
▶Related Article:The world of English is not just American and British English
3. Summary
This time, under the theme “Understanding the Average American,” we've introduced an overview of American consumers from perspectives such as population composition, lifestyles, and values.
While “average” is not a universal metric that explains everything, it serves as a highly effective starting point for developing business strategies. Grasping the overall picture first, then deepening persona design and segment analysis from there, will lead to a more precise understanding of consumers.
Additionally, to efficiently and concretely grasp the “average lifestyle” and values of Americans, we encourage you to utilize solutions provided by INTAGE, such as “Consumer Life Panorama” and “Global Viewer.”
-

Editor profile
Chew Fong-Tat
Malaysian researcher who has lived in Japan for 14 years and has handled many surveys on ASEAN countries.
Other related article:
-
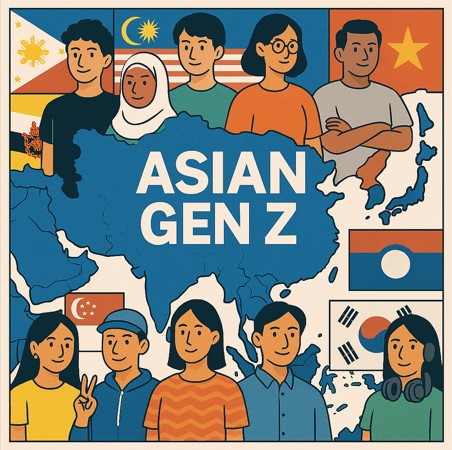
Understanding Generation Z Around the World: Country-Specific Trends Through Values and Daily Life
-

2025 Edition|What is Real Life in China? Daily Habits and Current Trends Marketers Should Know
-

How Do “Marriages” Differ Across Asian Countries!? And the Consumption Behaviors That Come With Marriage ~ Bride Price? Groom Price? What About the Funds? ~